
How do I visualize how work actually gets done vs. how it should get done?
With most of your basic first-time manager training now done – or should I say the training in the Knowledge Base I keep creating here – it’s time to glance beyond and reflect a bit on a topic that might just put you off at the very sound of it: process mapping.
You might be thinking that this is something operational nerds do, and you will for sure never touch it because… why would you? Well, truth be told, there is only one way to accurately, efficiently, and correctly visualize how your processes work: mapping. The concept might appear very complex and intended only for those with extensive know-how on the subject, but in reality, it’s a very simple, easy-to-follow, and intuitive framework. All you really need to know are the basics.
What do I need to do in order to view both my current process and my future process?
Process mapping deconstructs complex operational workflows into basic schematic symbols to clearly visualize your current “As Is” reality, identify bottlenecks like waiting times and manual steps, and eliminate low-value tasks, enabling first-time managers to establish streamlined “To Be” processes and execute smooth team transitions through small-scale pilot testing.
Your first-time manager Process Mapping Roadmap:
| STAGE | FOCUS AREA | KEY POINTS |
| Why is Process Mapping a thing in the corporate world? | Full business overview, avoiding the Expert Syndrome, gut feelings vs. data, and recognizing processes as complex ecosystems. | Gaining total process visibility, overcoming the trap of gut-feeling decision-making, and respecting the complex stakeholder ecosystems behind daily operations. |
| But what is process mapping anyway? | Process deconstruction, start and finish points, decision nodes, inputs, and transforming SOPs into schematics. | Breaking down standard operating procedures into visual schematics defined by precise sequence, inputs, decision branches, and endpoints. |
| How to create a process map? | Framework accuracy for managers, using Excel or PowerPoint instead of Visio, and core flowchart symbols including Start/End, Connectors, Input, Process, and Decision. | Leveraging accessible office tools like Excel or PowerPoint, applying proper flowchart shape conventions, and mapping simplified sequential workflows. |
| The “As Is” reality | As Is vs. To Be concepts, gathering subject matter experts, capturing daily operational reality over written procedures, workarounds, shadow spreadsheets, and informal approvals. | Assembling tenured subject matter experts, documenting actual day-to-day behavior over official procedures, and capturing hidden workarounds, shadow spreadsheets, and informal sign-offs. |
| The Bottlenecks and Friction | Identifying classic pain points like infinite waiting periods, redundant checks, lost context, cracks in hand-offs, and target automation for manual steps. | Pinpointing operational delays from excessive waiting times, eliminating unnecessary double-checks, repairing broken hand-offs, and identifying non-value-add manual tasks for automation. |
| Building your “To Be” | Eliminating low-value steps over adding new tools, clean hand-offs with clear ownership, and reducing overall touchpoints and loop times. | Streamlining future workflows by stripping out redundant touchpoints and loop times, clarifying step-by-step ownership, and resisting the urge to solve process flaws with extra software. |
| “To Be” implementation | Helping teams unlearn old habits through coaching, running pilot test realms, and realistically adjusting for unintended friction. | Guiding teams through habit changes via active coaching, validating new workflows through small-scale pilot groups, and fine-tuning minor unexpected friction points during rollout. |
Why is Process Mapping a thing in the corporate world?
A great question! Any successful business, small or big, must have a complete overview of what it is doing. To achieve this, it requires a deep dive into all the actions performed. Let’s take a very basic example of a standard lemonade stand: to know how much lemonade you are making, to understand how to fix something, and to identify areas of improvement, you need to map out everything you are doing – there’s just no other way to do it.
I have talked about this in other articles, but a lot of times – and especially for first-time managers having less exposure or a lack of proper training and coaching – people spend a lot of time doing something they should not: fixing the process before they understand how broken it is. I call this the “Expert Syndrome,” and it goes like this: since I am the leader and I know better than everyone else, I will just go ahead and decide based on my “gut feeling” what is wrong and how to fix it. Sadly for them, most times – and without proper data – your gut feeling will betray you. You start investing in improvements you think are the best way to address the problem at hand, only to end up creating even more problems or realizing that everything you did to fix things simply isn’t working.
I am sure by now you all know and understand that processes are not just simple steps we do in our day-to-day jobs: they are complex ecosystems that stretch across multiple business areas, with layers upon layers of stakeholders and touchpoints, and with real financial and (sometimes legal) aspects that must be considered. Given these factors, understanding and fixing processes is not as easy as giving them a quick eye check; you need a proper overview. The only real way to approach this in an efficient manner is by doing process mapping.
But what is process mapping anyway?
Put simply, it’s when we deconstruct a process into its basic steps, establish the start/finish, identify the decision nodes, determine the inputs, and draw the direction of each step. Basically, we transform a process that might normally be captured in a Standard Operating Procedure into a schematic.
How to create a process map?
With so much information available online – and, may I add, some of it completely incorrect – it’s important to stick to accurate sources that are as close to the actual frameworks as possible. Let me teach you how to do it in a way that is accurate and by the book, but also adapted for a first-time manager, not a Six Sigma Master who does this as part of their day-to-day job. What you need right now is a simple, easy-to-create, and practical approach.
To understand process mapping, we need to understand the core symbols we use. You can use Excel, PowerPoint, or other tools with similar functionalities. I use these because I have access to them (and they are the most widely used). Note, however, that formal process mapping is often done in Visio – a tool specifically created for this purpose. But a license costs money, and the likelihood of a first-time manager getting approval for Visio is small, so we must make do with what we have.
Now, before we get started, if you really don’t want to be completely lost, I would suggest looking over these articles for a quick understanding of the larger concept:
- 8 Types of Waste in Operations: DOWNTIME
- Value Add Activity: First-Time Manager Handbook
- SIPOC: Creating a Process Diagram
The main symbols we will be using are:
- Start / End: These highlight where the process starts and where it ends; you only use them for this purpose, nothing else.
- Connectors: These show the direction of your process and how one step connects to another.
- Input: This indicates any input that goes into your process (for example, in the lemonade stand, this would indicate the ingredients used to make lemonade).
- Process: This shows a process step.
- Decision: This indicates each time a decision needs to be made in your process. It usually splits into a Yes / No situation, with each path linking to another process step.
Each symbol uses a very specific shape and nothing else. These shapes are:
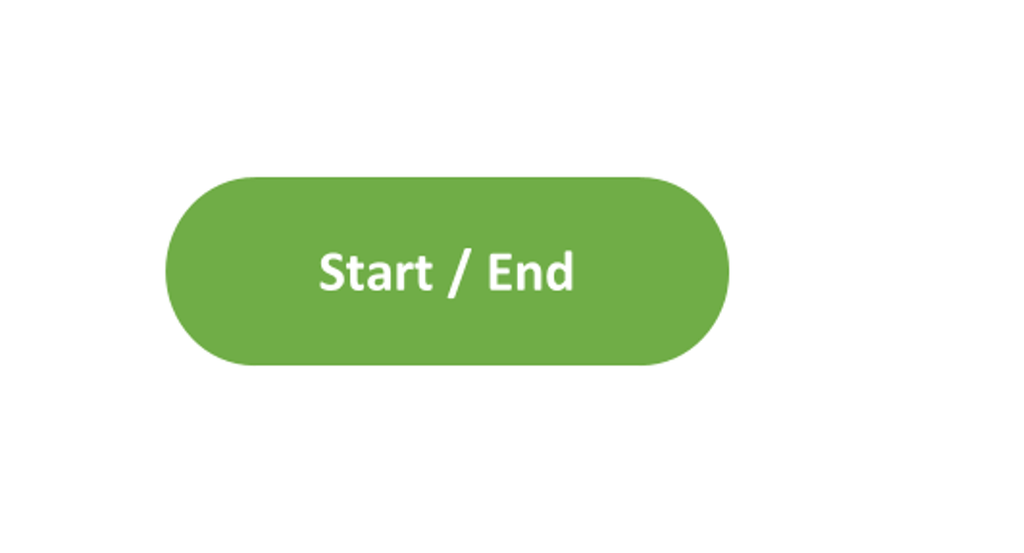
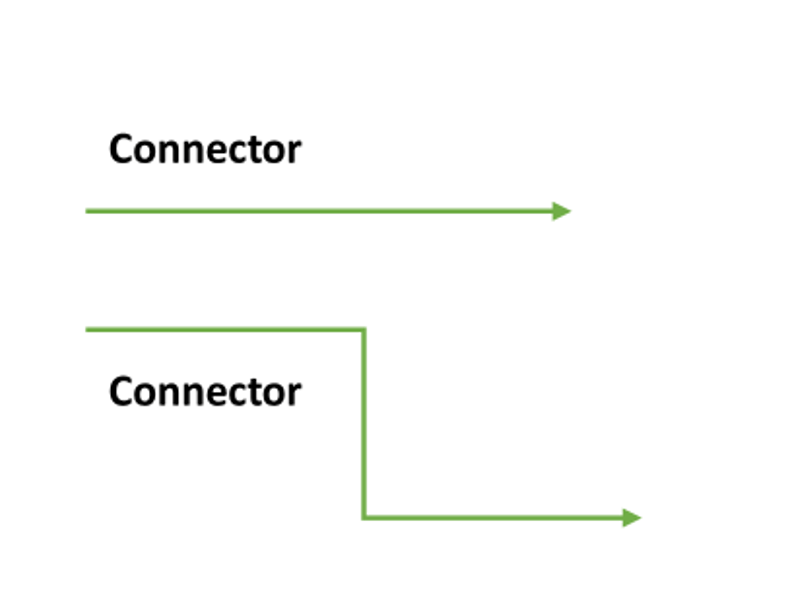
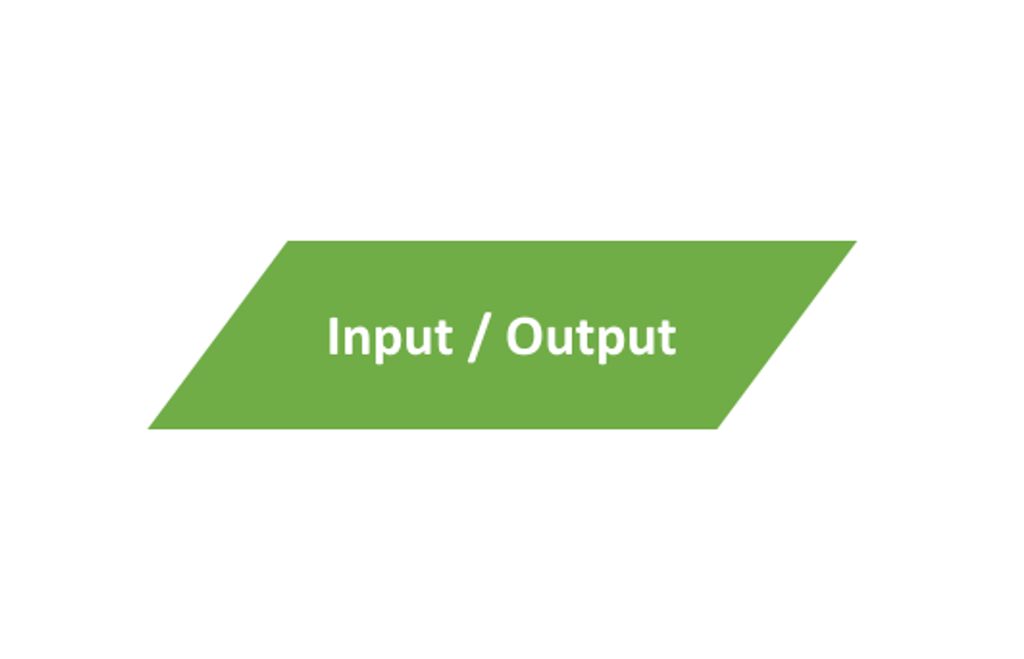

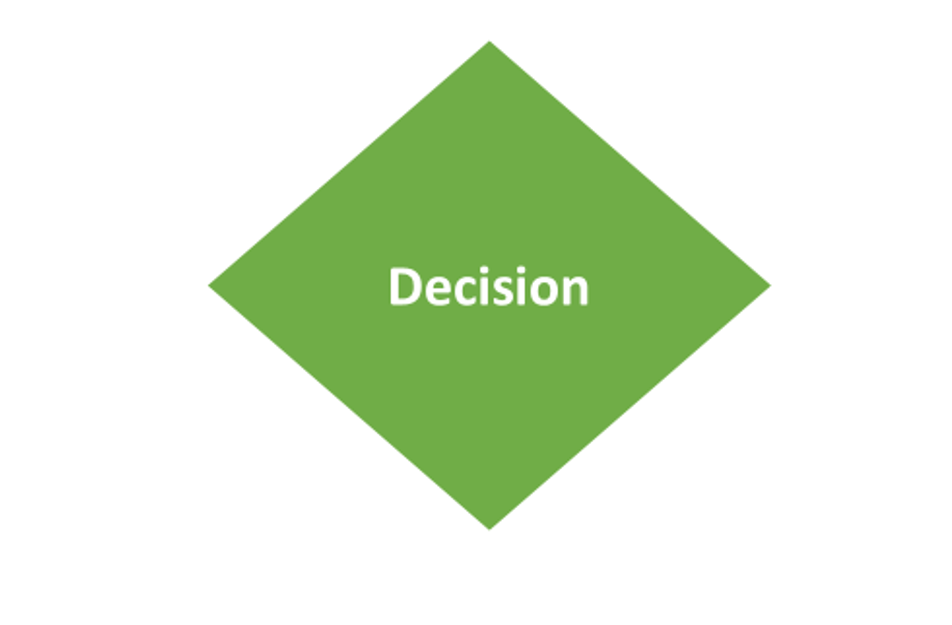
You will find these symbols in both Excel and PowerPoint under the Shapes options, specifically at the bottom under Flowchart.
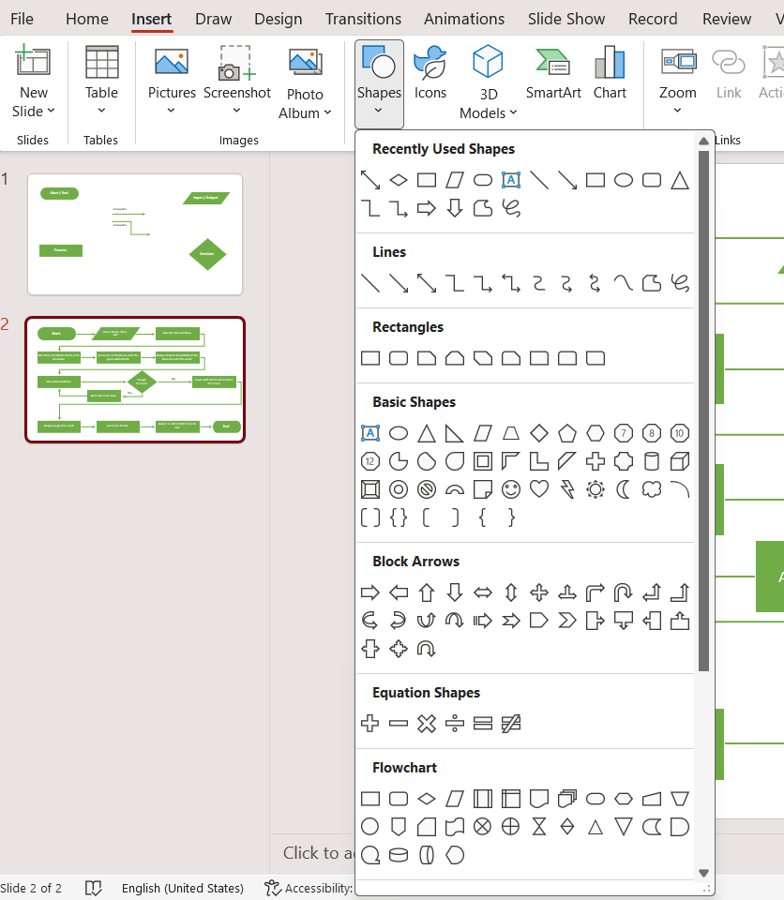
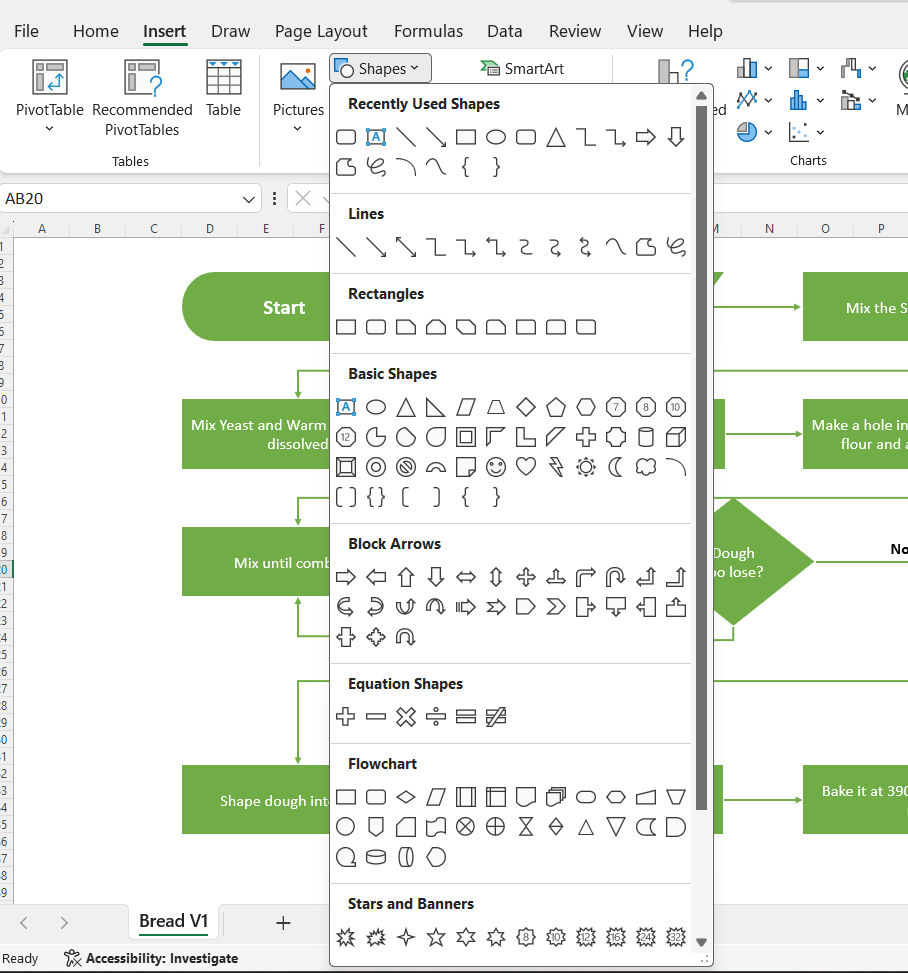
With the basic symbols and background up to date, it’s time to actually see what it looks like. Let’s take a very simple example: making bread, because we all love bread, right? RIGHT?
The first step is to break down the process into very simple steps, like: mixing the flour and salt, adding the yeast to water and mixing it, letting the yeast activate, mixing the wet and dry ingredients, letting the dough rise, shaping it, letting it rise again, and baking it. Once that is done, we copy each step into the map, use the correct symbols, and draw the connectors showing the flow from one step to another (the arrow always points from the previous step to the next).
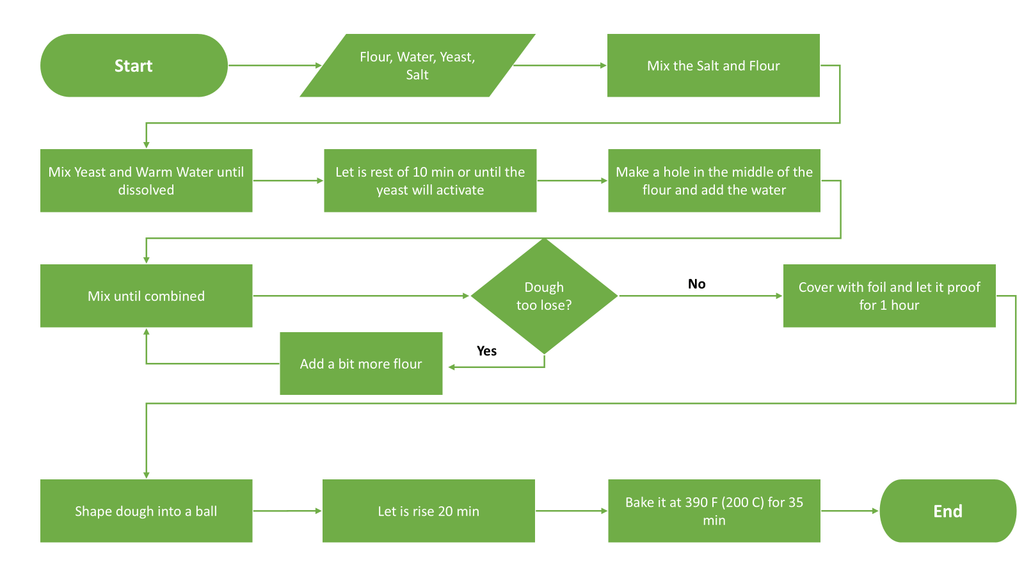
The Excel variant looks basically the same, just inside Excel.
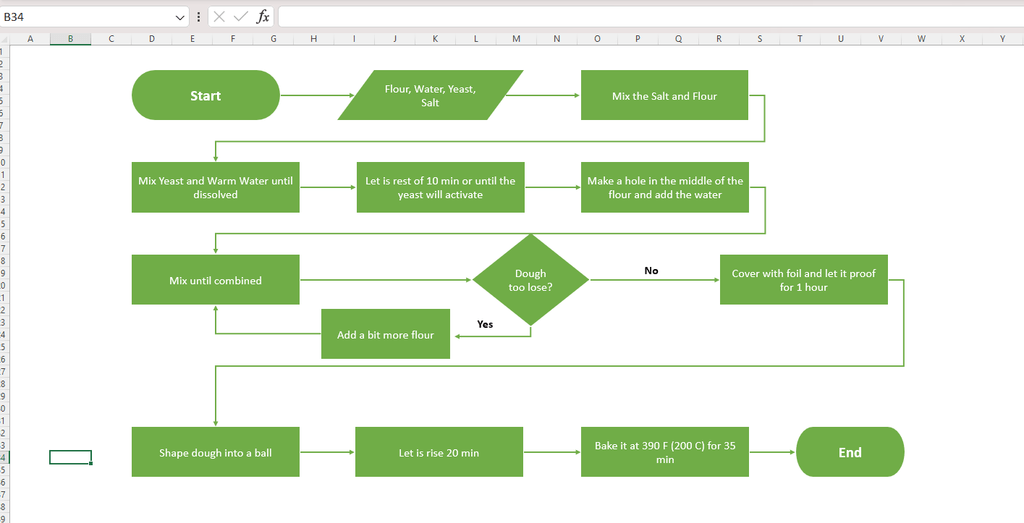
In this example, I also added a decision based on how runny the dough is: if “Yes”, you add a bit more flour and go back to mixing. Please observe that the input symbol is reserved for the specific ingredients you are using. Note that this is a very basic example and is not meant to be used for high-level enterprise process mapping; this is a simple example for the first-time manager trying to figure out what their processes look like when they do not have a dedicated support function to do this job for them.
The “As Is” reality
When we talk about continuous improvement, especially from a process design point of view, we work with two main concepts: the current reality and the future reality. In corporate lingo, these are called “As Is” and “To Be” – meaning this is the process we have right now, and that is the process we want to achieve.
We use this approach because when we want to improve something, we might end up changing core aspects of the process. To make sure we consider every possible impact (humanly possible, anyway), we must capture both pictures. If you don’t, and simply transform the process without capturing how it looked beforehand, you end up in a very strange place where you no longer know how the process started out. Remember the three magic words: document, document, document.
Let’s assume you need to improve something in your process. The first step is to map out the current reality. Here are your basic steps for doing that:
- Gather a strong team of process experts: This is non-negotiable – it is a must. Do not rely solely on your own skills and know-how. Always make sure these sessions include Subject Matter Experts, the most tenured employees, or the people with the most day-to-day exposure to the process.
- Let the experts list all the steps: The best thing you can do is simply be there to take notes, ask open-ended questions, keep the discussion on track, and ensure people have a productive meeting rather than a confrontation or a battle of egos.
- Track each step, input, decision, and connection: Map out how every element flows into the next.
- Train yourself to take proper notes: Make sure each step has a number in front of it (1., 2., 3., etc.). Don’t write novels – keep the steps short and to the point. It is best to include processing times (if available) and always ask clarifying questions when something is unclear.
- Don’t let the experts steer the conversation to exceptions: This is a very common mistake people make – jumping directly to exceptional situations. Start by making sure they talk about the standard way of working first, and save the exceptions for later. If the exceptions are vastly different, create a separate map for them, but never use an exception as your baseline.
With these steps complete, it’s time to put on your headphones, blast some music, and start moving the process from your notes into an actual map. Once the map is completed, you have a full view of what the process you need to improve actually looks like.
This is the moment you set up another meeting with your experts to look at the bottlenecks, issues, errors, waste, or whatever else is wrong with it. You can use Fishbone Diagrams (Ishikawa) for Complex Issues as a great way to capture these problems and link them directly to the process.
Keep in mind that you need to map out what the team is actually doing in day-to-day operations, not just transfer a written procedure onto a schematic. Sometimes the SOP will say one thing, but the reality is completely different. Remember that “As Is” is about reality, not a Word file with instructions that aren’t even being followed.
A few extra things to consider:
- Capture the workarounds: You might not think they are relevant, but if they are part of the day-to-day reality – if people are using them regularly – then they are the process, not just a quick temporary fix.
- Shadow spreadsheets: These are the custom Excel files, personal trackers, or desktop lists created by individual team members because the core company software lacks key features, reporting, or reliability. Most employees use them because it helps them do their jobs faster, and it’s right there where you might find some of the solutions to your issues.
- Informal approvals: These are the sign-offs and hand-offs that happen via Slack/Teams messages, hallway conversations, or quick verbal “looks good” nods rather than tracked, formal workflow steps.
Bottlenecks and Friction
With the process mapped out right in front of us, it is now time to check for bottlenecks and friction points. For first-timers, this can be a bit challenging since it takes some experience and exposure to get into the “continuous improvement expert” mindset. However, there are steps you can take as a beginner to make your life easier.
The first step is to identify classic pain points:
- Infinite waiting periods: Waiting time is one of the biggest issues in modern company processes. Beyond the immediate delay, it causes secondary problems like increased backlogs (if employees are stuck waiting), poor customer experiences, decreased response rates, and higher workloads for downstream teams.
- Redundant checks: This is another classic pain point added to processes under the guise of maintaining quality. You don’t need to triple-check everything all the time. While a double-check is acceptable for high-risk, high-impact cases, most redundant checks should be re-evaluated: do we really need this step?
- Lost context: Sometimes the context of a task gets lost due to process complexity or too many hand-offs. We need to check whether we still have proper visibility: are we still working on Task X, or have we drifted into Tasks Y and Z without realizing it? Examples you might relate to include tickets bouncing between support teams, escalations without explanations, version control chaos in email threads where outdated files are used, or disjointed software hand-offs where unsynced systems create logical errors.
With classic pain points identified, look closely at the small cracks created by hand-offs where tasks easily fall through. In complex, multi-layered, and cross-departmental processes that aren’t regularly reviewed, these gaps naturally appear. This leads to bizarre exceptions, strange workarounds, or wasted time fixing preventable errors. Ultimately, people will always find an easier way to complete a task – especially if they are evaluated against operational targets (as 99% of employees are).
Finally, look at manual steps. Put simply: whenever you see a manual step, your first thought should be, “How can we automate this?” Some people worry about software replacing human effort, but automation has been a staple of efficient workflows for years. We simply shouldn’t waste human time, energy, or morale on repetitive, low-value tasks when a tool can handle them. Again, this applies specifically to work that adds no real value, is purely manual, and causes employee frustration.
Building your “To Be”
Designing what the process should look like is no easy task. There are many variables to consider, and it can feel overwhelming at first. But don’t panic – everything feels hard until you start doing it.
First things first: STOP adding new tools when you can simply remove low-value steps. People are often quick to introduce new software or platforms, thinking it will automatically improve the process, when in reality it can make things worse than the “As Is” state. Less is more. The primary goal of process redesign is to make work simple, fast, and efficient – not complex, heavy, and frustrating. I highlight this first because, surprisingly, adding tools is often the first instinct people have.
Another critical factor when redesigning a process is establishing clean hand-offs. Design the workflow so that ownership is crystal clear at every single step, leaving as little room for confusion or unexpected exceptions as possible. Companies sometimes run massive redesign workshops only to end up with more confusion and more hand-offs than they started with. That defeats the purpose of a “To Be” state – we don’t want to go from “this is hard and wastes time” to “this is even harder and involves twice as many people.”
Finally, evaluate the total number of steps: review the process and eliminate as many unnecessary steps, touchpoints, and loop-backs as possible. Unless a loop or re-work cycle is strictly necessary, remove it. Less is more!
“To Be” Implementation
You might think moving from the “As Is” state to the future “To Be” state is simple: eliminate the old way of working, introduce the new one, and voilà – business as usual. If you believe that, you are in for a surprise. Reality is very different: change is uncomfortable, and regardless of the clear benefits, people rarely accept it without resistance. You need to carefully prepare for the transition.
Start by helping your team unlearn old habits without making them feel micromanaged. Every workflow creates specific routines that employees get used to over time. When a new process is introduced, adapting can be difficult. This is where you, as the leader, step in: prepare the team, help them understand why the old habits are no longer effective, coach them, and monitor the transition closely to minimize friction. You don’t need to hover over them like a dictator; simply be present, listen, and offer guidance when needed.
If you are a gamer, you might be familiar with the concept of a Test Realm (or Alpha/Beta testing), where players test upcoming content before its official release. Similarly, rolling out a “To Be” process should start with a small-scale pilot: select a few team members to run the new process first. The data and feedback gathered from this pilot will provide valuable insights to refine the workflow before a full rollout.
Lastly, be realistic about unintended friction. Unexpected issues will arise even if you planned thoroughly and followed every best practice. The key is not to panic or assume the entire project failed. Focus on the specific points of friction and make targeted adjustments. You rarely need to rework the entire process – small, incremental corrections are usually all it takes.
And that concludes our guide to process mapping and transitioning from the “As Is” state to your desired “To Be” state. Until the next article, stay safe, healthy, and happy!