
How do I prevent people from gaming the numbers I track?
Have you ever wondered why, in some situations, the metrics that are technically designed to be the best possible reflection of the business direction are not really working out as they should be? In our current corporate life, much of the day-to-day operations (and also ways of working and reacting) have changed significantly – at least compared to years back. We are now sitting on the precipice of data-driven success and constant “KPI-fication,” where everything is transformed into a target: how much time you spend with your customer, the quality of every call and email, how much effort you spend on tasks, emails answered, the level of satisfaction customers have after they interact with you, the number of exceptions you answer and how fast you are closing them, and many more.
This new-age way of working, while taking advantage of newer technologies and better business insights and studies, has an unfortunate side effect: the way humans interact with it. Because we are not machines, we react rather differently when KPIs transition from a “normal business or performance indicator” to an “absurd quantification of results.” It is in these situations when people start to game KPIs and create what is often called the “Watermelon Effect,” when metrics are green but customer satisfaction is very bad. This was also established by British economist Charles Goodhart in 1975 when he described monetary policy issues: the concept highlighting what happens when human behavior reacts to optimization metrics. Once an indicator is tied to a reward, punishment, or policy goal, people alter their actions to hit the number – frequently undermining the core outcome the metric was supposed to track.
What should I do to spot and prevent metric gaming?
When metrics shift from business indicators to strict targets tied to rewards or penalties, employees often game the numbers – creating a deceptive “watermelon effect” where dashboards appear green while actual outcomes collapse – which leaders can prevent by pairing quantity with quality guardrails, stress-testing new metrics through pre-mortems, and leading with context rather than enforcing rigid numerical goals.
Your basic metric backfire RoadMap:
| STAGE | FOCUS AREA | KEY POINTS |
| When Good Metrics Go Bad | Focuses on how tying contact center metrics directly to financial incentives or job security forces employees to game numbers instead of solving customer problems. | Focus team efforts on overall performance averages rather than forcing every single customer interaction into a strict duration target. |
| When Good People Turn Bad | Focuses on identifying the warning signs of metric gaming, such as the divergence between high output metrics and collapsing quality indicators. | Cross-reference output metrics against quality indicators (like CSAT or reopen rates) to spot inverse divergence and performance anomalies. |
| But why do employees turn to gaming? | Explores the root drivers of gaming behavior, including unrealistic targets, systemic exhaustion, management disconnects, fear, and peer pressure. | Set realistic baselines, eliminate fear-based penalties, and build open channels for teams to challenge broken targets. |
| When good leadership stops metric fixing | Outlines proactive leader-led solutions to prevent metric fixing, such as pairing volume indicators with quality guardrails and stress-testing new targets. | Pair speed/volume metrics with quality guardrails, and stress-test new metrics using pre-mortems, shadow periods, and impact matrices. |
| When harmony kicks in and we lead with context over raw numbers | Emphasizes shifting management focus from using targets as performance hammers to using them as conversation starters that reward honest reporting and value long-term team health. | Use metrics as conversation starters, reward honest reporting over pretty green dashboards, and eliminate obsolete KPIs. |
When Good Metrics Go Bad
To better understand the concept, let’s take a very simple example of a team working in a contact center. Their job is to answer customer requests, mostly via phone call, regarding payments, services offered, returns, etc. To measure the success of their customer support department, the company will implement a series of metrics to help track performance, like:
- Average Call Duration – how much time each rep spends with the customer
- Average Speed of Answer – how fast each rep will take another call
- After-Call Work – how much time each rep will spend on post-call work (indexing, moving the request to other departments, making whatever corrections they need in the system, etc.)
- Average Number of Calls per Day – how many calls reps are handling each day
For now, this looks perfectly normal and paints a very common and basic image of what a support department looks like. If things were kept just like this, we would not have any Goodhart’s Law issues, but the reality is a bit different. Having the metrics is just not enough, so companies tie them to strict targets that are in turn linked to other aspects: performance, bonuses, improvement plans, risk of job loss, etc.
When this happens, we see a very interesting shift, and metrics like Average Call Duration transition from just measuring how much time each rep spent on a call to forcing the rep to have calls that fit a specific target (instead of spending 30 minutes on the call because that is what is needed, they will call the customer 3 times to have 10 minutes maximum per call – so as to fit the agreed target). This is called gaming the metrics, or in simple terms, a way to “fix” and adapt metrics.
This phenomenon happens way more often than you think. Most people in the corporate environment will game metrics because the alternative means you are either a low performer or you just don’t fit in. No one will understand this better than someone working in sales: they are masters of metric gaming due to the specific financial incentive attached to each task. When we game metrics, we give way to a very strange phenomenon called the watermelon effect: all our metrics are on target, but the customer is not satisfied with the results.
You might be thinking, wait a minute, what can I ultimately do from this point of view? How can I stop the company from putting absurd targets on metrics, as a lonely lead? And you would be correct – you can’t. It’s not about stopping metric target setting; it’s about shifting your team’s perspective from measuring success to making it the goal. As a leader, it’s up to you to create a space where people understand it’s not about having all of your calls (for example) below a 10-minute duration; it’s about making sure the ones that need 20–30 minutes get it while keeping the overall average within its limits.
Not all of your customers will need half an hour for problem fixing, so instead of having these ridiculous scenarios where you call someone 4 times to fit the duration, just go with the flow and keep your eye on the monthly average. This is where you, the leader, come in and reinforce this message and explain to people that it’s absolutely fine to dedicate more time to customers in need of it.
When leaders take part in the constant message reminder that “calls above 10 minutes are not OK,” you accidentally reward bad behavior. You are basically saying, “it’s OK to call multiple times for a short duration.” This is why management is not just about monitoring what your team does; it’s also about looking beyond the visible and trying to understand the behavior behind the lines. These bad habits are, on one side, created because of the narrative (target setting on almost everything) and because we don’t read enough between the lines or are not looking where we are supposed to.
When Good People Turn Bad
Now that we understand the concept, how do we spot gaming? Well, there are a lot of signs out there, so let’s just take a look at the major ones. The first and probably the most common warning sign of metric gaming is the spike in performance that does not match the bottom-line outcome (for example, ticket resolution volumes go up, but customer satisfaction drops). I have an example we can look at to better see how this actually looks.
We start with a normal (healthy) process where we have: tickets closed, first-call resolution, customer satisfaction, and re-open rate. A good (and simple) practice to catch any potential gaming is to match the metric you have suspicions about (in our example, the tickets closed) with others and look at the patterns. A normal process would look like this if we try to match them:
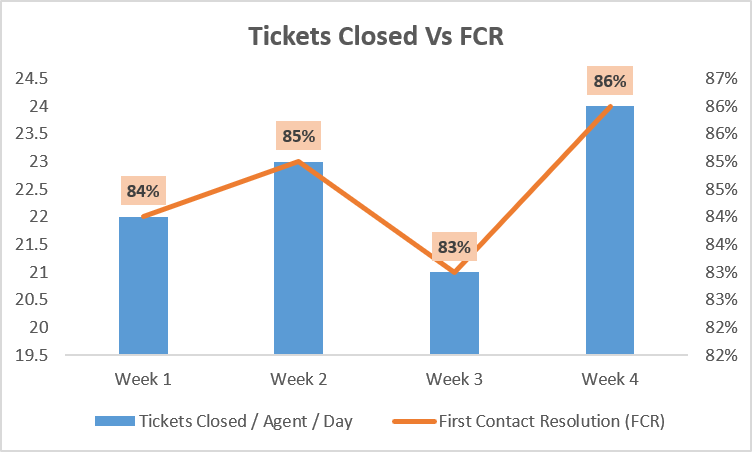
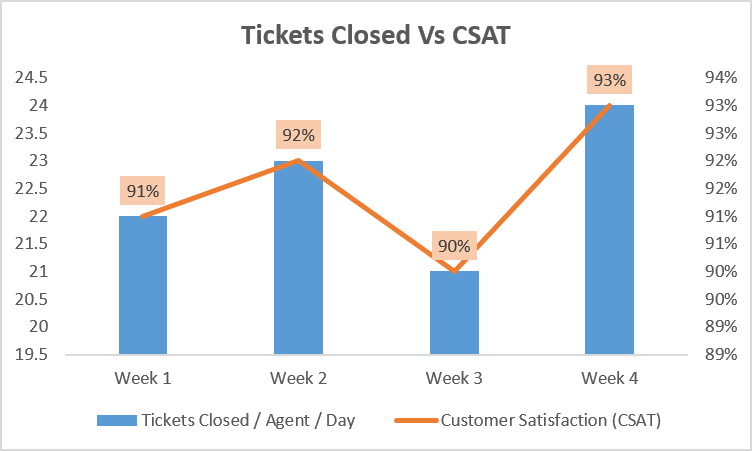
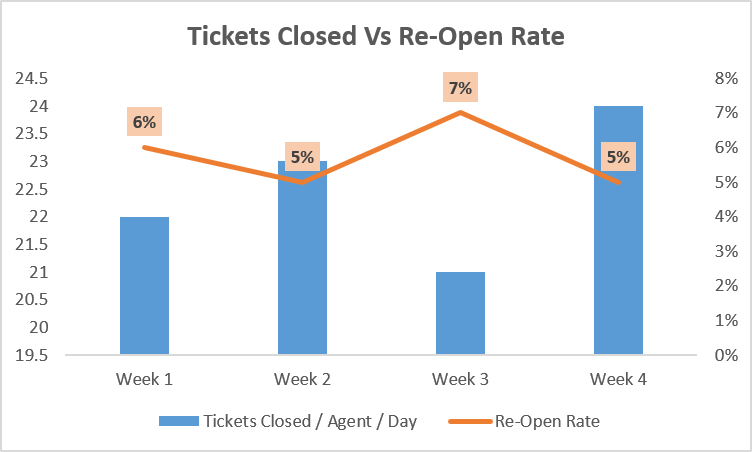
As you can see, all metrics appear to be completely normal: they are predictable, with proportional relationships across all metrics. We can assume, in this case, that high resolution counts are driven by actual problem-solving and proper process adherence.
Now let’s see an example where a new target is introduced in the first week.
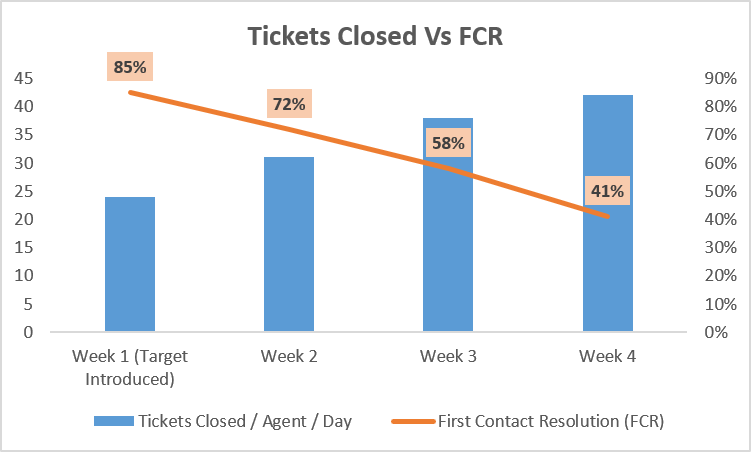
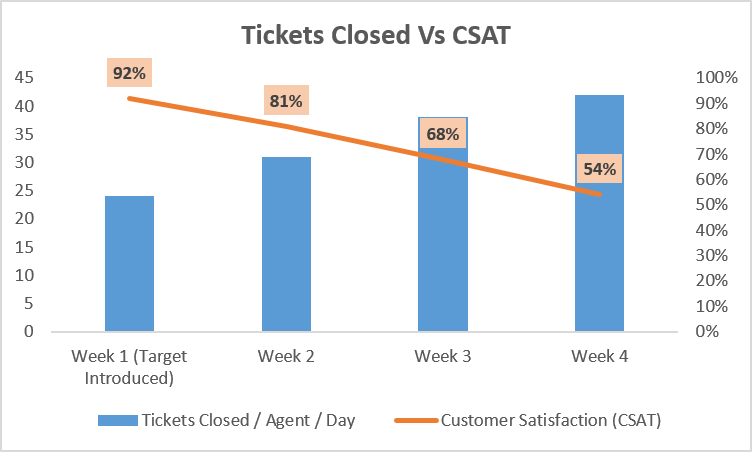
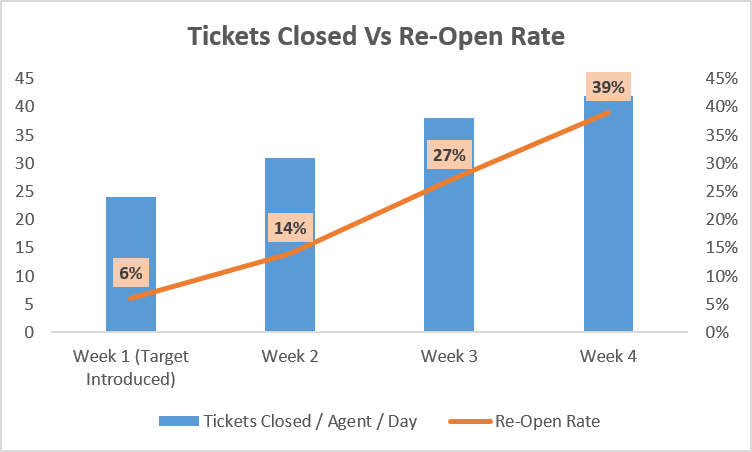
What do we see here? Well, tickets closed increase from one week to another. Great, right? No, it’s not, because while the volume of closed tickets is increasing, the quality is severely impacted: first-call resolution goes down, CSAT is at almost half by the end of week 4, and the re-open cases increased from 6% to 39%. We call this an inverse divergence, where metrics look outstanding on paper, but all outcome-based metrics collapse. Potential causes for this:
- Agents split single customer issues into multiple smaller tickets
- Reps send fast, automated template responses (“Thanks for reaching out, closing this for now”) to prematurely mark tickets resolved and reset SLA clocks
- Complex, time-consuming issues were passed off or delayed so they wouldn’t hurt individual daily tallies
With this understood, let’s now look at other signs that can act as a trigger for you in the future:
- Threshold bunching, where work consistently clusters right at the bare minimum requirement to pass
- Shift in team vocabulary from problem-solving to “counting” (asking if an action “counts toward the goal” instead of if it creates value)
- Disappearing edge cases, where complex tasks are quietly delayed or passed off so they don’t drag down averages
- Clean, perfect green dashboards that don’t match the noisy reality on the ground
In addition to sign-spotting, we also must talk about the hidden impact these types of shenanigans have: quality, morale, and especially the trust that numbers can no longer be relied upon.
Quality is the first one impacted in this situation because people will start replacing thoroughness with speed and volume, thus impacting the overall quality of the activity. You can’t deliver fast and high-quality volumes when your normality is different (high quality requires time, meaning lower volumes for better customer satisfaction).
Then we have cynicism, where a culture is created around it with people feeling forced to perform success rather than achieving it. It’s that very fine difference between what you want your business to become and the impact that improper target setting and communication cause. Just think about all those calls to customer support where you end up feeling like another case number that has to be rushed because the agent talking to you has a target to close the call within parameters.
And here’s an aspect I’m sure you did not think about: what are you going to do with the people who don’t take part in the “fixing”? While the ones doing this will be marked as high performers and rewarded, the ones actually doing what they are supposed to will be overlooked. Fair? No, you are just encouraging people to cheat.
Remember that management is all about the human experience, and with this type of behavior, you will create a psychological degradation in the safety space of the team, making team members afraid of highlighting broken processes. Ultimately, everyone will just start doing this, and you end up with a blind spot. When leadership relies on misleading green metrics without looking at other layers of the process, they create a blind spot that will eventually generate a major failure. Usually, because no one is looking left, right, above, or below, the failures tend to be bigger and harder to resolve. This is not a simple fix generated from a little waste or something wrong with a procedure; this is part strategy and part human behavior. While you can fix the strategy, the behavior already created… well, that’s something you must work on for many months to come. The precedent has already been set.
But why do employees turn to gaming?
Simple: because the targets that some companies place are simply not realistic. When confronted with an impossible situation, self-preservation skills kick in: failing metrics carry heavy penalties, so people are afraid. We do “our best work” when we are afraid – best, of course, used ironically. The craziest and most dangerous ideas we humans have come up with arose from fear.
Another reason is systemic exhaustion from being asked, sometimes over and over again, to deliver impossible things without additional resources. This ties into what I was talking about in the article Establishing Accurate Operational Baselines. I wrote an entire chapter there about how ridiculous some of these social-media “new-age” posts are, and how what some managers are doing with target setups is false, with no actual scientific basis behind it. But if you want to see how YOU SHOULD do it, read the rest of the article – it’s all there in a friendly first-time manager format.
And since we touched on manager aspects, this is another reason you can add to the list of why good people do bad things: the disconnect between leadership and day-to-day operations is a real thing, more common than you think. Many rely on spreadsheet projections instead of front-line realities. Confronted with this reality, many people just do the best they can to execute the leadership strategy. Not everyone will challenge authority, and even when they do, depending on the person on the other side, the outcome can be very, very different.
Peer pressure is another reason as well: you can’t stay the only honest man in a country of thieves. Eventually, you will also want to be part of the normality and do whatever the rest are doing, especially if you have to suffer when not doing it.
Lastly, we need to mention the lack of safe channels to challenge the validity of a target without being labeled a low performer. This ties into the entire narrative of “what NOT to do” as a people manager.
When good leadership stops metric fixing
With the background and motivation of fixing established, it’s time to talk about what we can specifically do to stop it.
Pairing speed or quantity metrics with quality guardrails is your first stop. Look at speed- and quantity-related indicators and pair them with quality-related ones, like in the example I shared above where the volume of closed tickets was “matched” with customer satisfaction or re-open rate. You don’t need to be over the top and create crazy high-level analytics for this; a simple table with volumes and quality will offer you everything you need initially. From this table, just create a combo chart in Excel with quality (for example) as a secondary axis, and you have the visual as well.
A more time-focused approach is to balance short-term targets with long-term health. It’s fine to have short-term faster work due to specific business reasons, as long as you keep a very close eye on quality. Normally, or at least in the places I worked at or from the research I did, companies try to juggle between these 2 aspects (quantity and quality), sometimes sacrificing one for the other and vice-versa. It’s not really a practical approach in the long term. A better way is to communicate the strategy and align your people on what is needed in the short term (say, an increase in closed tickets during the month of December), make it clear it’s short-term, and offer as much support as you can for the quality side of it. Remember, it’s teamwork not “I say, you execute.”
But what about proactive measures? How do you approach a prevention system for new targets? How do you test a new target for loopholes?
Start with stress-testing it: before any reviews, any rewards, or team goals are established, check out human behavior and see what happens. If it can be fixed, someone will, out of pure self-preservation or challenge.
The Pre-Mortem Session: Gather your best and place before them a scenario like this one: “Assume it is 6 months from now. This new metric was introduced, and we hit 100% of our target. However, our actual quality destroyed customer trust and broke team morale. How did we achieve the metric while ruining the outcome?” Now you listen for shortcuts, technical workarounds, and “lazy compliance” hacks that fulfill the letter of the rule while ignoring the spirit.
The Path of Least Resistance is another way to check. Evaluate the effort required to produce real value versus the effort required to game the system. If gaming the metric is significantly easier than doing the actual work, the metric will be gamed.
The Unintended Consequences Matrix: Evaluate how optimizing for the new metric impacts adjacent departments, processes, and people.
| Question | What You Are Testing | Example Risk |
| Downstream Impact | Who suffers if this number goes way up? | Pushing code faster overburdens the QA/testing team with bug triage. |
| Data Boundary | What gets excluded or hidden to keep this green? | Agents stop logging edge-case tickets to keep average resolution times fast. |
| Interpersonal Incentives | Does this reward individual effort at the cost of teamwork? | Sales reps hoard leads instead of passing them to specialists. |
The Shadow Test – Silent Soft Launch: Track the new metric quietly for 30 to 60 days without attaching any incentives, public leaderboards, or performance ratings to it. Observe how the metric behaves naturally alongside true business outcomes (revenue, CSAT, retention, code stability). Look for outliers in the data. If an individual or sub-team achieves an extraordinarily high number during the shadow period, interview them to see if it was genuine productivity or a flawed process.
When harmony kicks in and we lead with context over raw numbers
Stop using targets as an absolute “must reach or else” deal, and start using them as conversation starters. Using them as performance hammers is the best way to achieve metric fixing. Focusing instead on reality, on what you can do to help your team reach those targets, how to grow them, how to improve, and how to make things easier for them is what will, in the end, be that example of perfect harmony you need to remove much of the gaming risk.
Rewarding honest reporting instead of green dashboards should be your go-to from now on. I know green dashboards look pretty and your bosses will praise you for the amazing job you did, but the sacrifice you are making in the long term is not only punishing for the team, it’s also punishing for you: there’s no room in that approach to learn proper management. And don’t say proper management doesn’t get you rewards: people who turn to tricks hoping to succeed are in for a major letdown. The only way to get better and grow is the old-fashioned way: tears, sweat, and hard work over the years.
If you are ever in the position to stop using some of these metrics, listen to this advice: if it is no longer serving any purpose, just remove it. Don’t overburden your team with useless KPIs.
Until the next article, stay healthy, happy, and safe!