
How do I systematically predict how a new process might fail?
What do you do when you start working on a process and things just stop working? What about when things just generate errors out of nowhere? Do you stay in a constant fight-or-flight tension? Do you put in a lot of overtime to compensate? Ever thought about how to prevent all this?
In the life of a first-time manager, processes can be a tricky monster to handle, regardless of your experience level. This is why a simple tool like the FMEA can be of great help, and not just to first-timers, but to the more experienced ones as well. It’s just one of those things that some people know about, but people just don’t talk enough about it.
So, if you are tired of constant firefighting and overtime because your processes break out of nowhere, learn how to build a simple Excel-based FMEA with your team to spot failure points before they happen. By scoring risks and setting clear preventive actions, you’ll trade daily panic for smooth, predictable operations.
In this article:
- About the FMEA: Defines the tool, traces its military-to-corporate history, and explains how it prevents small-scale process “apocalypses.”
- The Basic Structure: Covers the core Excel columns, the 1-to-10 Severity, Occurrence, and Detectability scales, and how to calculate the Risk Priority Number (RPN).
- The Premium FMEA: Shows how to complete the tracker with corrective and preventive actions, Owners, Target Dates, and recalculated RPNs.
- How to Start an FMEA: Walks through gathering experts, mapping steps with SIPOC and Process Maps, capturing all risks, and maintaining real-time updates.
About the FMEA
First things first: what exactly is this FMEA?
Failure Mode and Effects Analysis (FMEA) is a very interesting tool (or analysis, if you prefer) that can help people predict potential future events in their processes – events that we otherwise catalog as errors and/or failure points. The basic idea behind it is to estimate what can go wrong with the process in order to better prepare and avoid such an event.
Like many other things, this also originated in the military field. This time we look at the United States, where in 1949 the U.S. Armed Forces created a procedure called “Procedures for Performing a Failure Mode, Effects and Criticality Analysis” in order to evaluate system reliability and the impact of single-point failures on mission success and personnel safety. During the 1960s, NASA took the concept and improved on it, adapting the FMEA for manned missions to space, especially to the Moon, as they wanted to send people there and back safely – and to do that, they needed to anticipate potential failures and have a very strict protocol put in place.
In the 1970s, it was adapted for the automotive industry in the civilian sector, and from there history just took over as it spread across industries and slowly but surely crept into day-to-day corporate life.
Today, the FMEA is ever-present in most jobs with various degrees of visibility. Projects that keep a closer eye on quality and continuous improvement will be more familiar with it, while the ones that prefer a more chaotic and “PANIK” state of mind are less familiar with it.
The best use of it is to foresee points of failure that could appear in your process and better prepare for them. Think about it like that “apocalyptic scenario” we all have in our heads and what we would do in case something on that level might happen – at a much smaller scale, of course!
The Basic Structure
To not overcomplicate things, let’s look at the FMEA with very basic eyes: it’s a simple Excel file that more or less follows a structure. It will always have these elements:
- Process Name or Step
- Potential Failure Mode
- Potential Effect of Failure
- Potential Causes
- Severity
- Occurrence
- Detectability
- RPN
Process Name or step is all about the specific part of your process that is currently investigated or evaluated for potential failures. Think of FMEA as a big tree with a lot of branches, and each branch is actually part of the process you are looking at. When we start building it (more details below), we look at everything we are doing in the process and select whatever steps or processes we want to evaluate.
Potential Failure Mode is all about HOW the process step will stop working. Keep in mind that one step will not have just one single, simple failure, but many more. In the FMEA, you try to identify these specific failures and capture them.
Potential Effect of Failure is simple: what happens when the failure occurs? What is the negative impact, the side effect, or the direct consequence of the process step not working as it should?
Potential causes are easy: what exactly would be causing these failures? A great way to identify them would be to use Root Cause Analysis (RCA): The Starter Pack, as a more structured approach to causality identification can make all the difference. You don’t want the wrong causes captured and resources focused on solutions for them – that would be a complete waste of time.
In any FMEA, regardless of the business area, there are four things you will always find: severity, occurrence, detectability, and RPN. Let’s take them one by one and see what each is all about.
Severity is a thought exercise that we do in order to assess (to the best of our abilities) how serious the failure might be. Please note from the start: while we are using a scientific method to establish potential failures, this is not an exact science, meaning some of the data we are capturing is based on expert opinions and personal input (sometimes). Like Occurrence and Detectability, Severity will have a scale of 1 to 10 that will establish how bad the situation might be.
| Rating | Severity (SEV) Description |
| 1 | Minor inconvenience / No customer impact |
| 2 | Slight customer irritation |
| 3 | Noticeable inconvenience |
| 4 | Minor service delay / Minor rework |
| 5 | Moderate impact on CSAT / Extra steps required |
| 6 | Significant delay / Customer complaint triggered |
| 7 | Major CSAT drop / Missed operational SLA |
| 8 | Financial loss / Escalated executive complaint |
| 9 | Critical regulatory / Compliance / Data breach risk |
| 10 | Total service breakdown / Legal violation |
Occurrence is all about trying to estimate how often this failure will occur if no corrective and preventive actions are taken. It’s a way of looking at a problem by asking yourself, “How often do I think I could have this issue: once per day, every week, or less often?” It will also have a scale of 1 to 10 that looks like this:
| Rating | Occurrence (OCC) Likelihood |
| 1 | Failure almost impossible (< 1 in 10,000) |
| 2 | Very low frequency (1 in 5,000) |
| 3 | Low frequency (1 in 2,000) |
| 4 | Occasional failure (1 in 1,000) |
| 5 | Moderate failure rate (1 in 500) |
| 6 | Frequent failure (1 in 200) |
| 7 | High failure rate (1 in 100) |
| 8 | Very high frequency (1 in 50) |
| 9 | Extremely high frequency (1 in 20) |
| 10 | Inevitable failure (> 1 in 10) |
Detectability is all about how easy (or hard) it is to detect the issue. Some failures will be a bit easier to see coming, while others will be more complicated and less obvious. We will, again, use a scale of 1 to 10, like so:
| Rating | Detection (DET) Ability |
| 1 | Certain automated detection before impact |
| 2 | High chance of early detection |
| 3 | Automated system alert / prompt detection |
| 4 | Good detection through routine reviews |
| 5 | Moderate detection probability |
| 6 | Low detection probability before customer notices |
| 7 | Poor detection / Manual spot check only |
| 8 | Very low detection probability |
| 9 | Almost impossible to detect in routine operations |
| 10 | No detection mechanisms present |
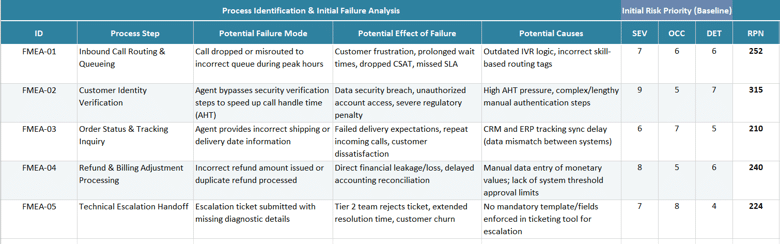
RPN, or Risk Priority Number, is the product of Severity * Occurrence * Detectability. If you have the following scores – Severity 9, Occurrence 6, and Detectability 5 – your RPN would be 9*6*5, meaning 270. We use the RPN to prioritize all the identified failures (or risks) and sort them from highest to lowest, as the goal is to focus on the highest risks and move downwards from there.
Now let’s put them all together and see what it would look like. A basic FMEA should look like this:
The Premium FMEA
Of course, it’s not about premium services – although it does appear that everything now is either premium or basic. In any case, a good, solid FMEA will also have a more robust list of features, meaning capturing just the basics is simply not enough, because it’s only half of the problem. Don’t do a half-baked job; take more time and do it properly.
Corrective actions are a must in any good FMEA because they will tell a story about what controls we currently have in place. This is a great indicator of how the process is managing the issue in case the failure actually occurs.
Preventive actions are all about proactive prevention, meaning what are we doing specifically to ensure that the failure will not actually appear?
When we create the FMEA, we will always have potential issues looming over us, and as such, we need people to take care of them – meaning, make sure things will be in place both from a corrective and a preventive point of view. We call these people Owners, and it’s their job to manage these open items. As such, another premium feature of the FMEA is assigning Owners and a Target Date (by which the specific open items will be fixed or implemented).
And finally, we need to recheck the Severity, Occurrence, and Detectability (and with it, the RPN) once the actions have been established. This way, we can compare the RPNs and see if, with the new methods, things will be better (meaning a lower risk).

How to Start an FMEA
In any FMEA, the first step is to identify the process steps. For this, you will need a team of experts. Don’t be fooled into thinking you can do this on your own, even if you are an expert – it is better to have more experts in a room and consult than to decide by yourself. Management is about proper team engagement, not solo decisions that lead to disasters.
So how do we identify the process steps? We begin where everything in your process begins: SIPOC and Process Maps.
- SIPOC will help us have a full and simplistic view of the overall process and will help us see the bigger picture. It’s not a mandatory step, but I find it useful because by looking at it, I am able to better understand what I need to focus on.
- Process Maps will offer the deep dive we need, as they have all the possible steps in the actual process, so it’s easy to look over them and estimate with your team which ones will have a potential failure worth looking into.
Once you have identified them, start capturing them one by one. Focus on a step-by-step approach when going over the failures, effects, and SOD. I find it easier this way because you have more people in the same room, so taking things one at a time will keep the focus in the correct place, rather than all over the place.
Make sure you are not ignoring things just because you (or another person) think it’s not that big of a deal. Some of the most banal-looking process steps can have the most severe impacts. Capture everything you can, judge them one by one, and then see if the RPN is high or not.
Like any other document, the FMEA will require a constant review process, so make sure you assign a responsible person for this task. A good practice is to check it once every 6 months, but if you can’t, just make sure you have the yearly review (this one is not skippable).
Any new tool, system, or change in procedure (regardless of whether the 6-to-12-month review period has passed or not) must be captured in the FMEA once it happens. Don’t wait – this is something you need to update in real time.
Well, folks, this is everything you need to know about the FMEA for now as a First-Time Manager. Remember that this job is not as easy as it seems, and every person needs help. This place provides that; all you have to do is check it out. If you have any suggestions, general questions about the job, or find yourself in a pickle and need friendly advice, please feel free to reach out to me here.
Until next time, enjoy life and take it easy!