
What do I do when a data point looks completely crazy or is missing?
Proper management of data and dealing with correct and accurate information is a story far older than you might think it is. For millennia, people have used data to make decisions and (of course) act on them. When the data is good, the decision-making goes well and the plan will proceed as expected, but when the data is bad, things take a very interesting turn, usually ending up in failure.
As people managers, you must also learn how to tackle this part of the job, since missing, anomalous, or outlier data will be part of your day-to-day. In an ideal world, this would never happen, of course, but as we all know and appreciate, we do not live there, but here rather – so it’s time to check and see how a first-time manager can manage data when it looks like a complete mess.
Managing data when it looks like a complete mess isn’t easy, but missing, anomalous, or outlier data comes with the territory. Before touching any analysis, you need a proper quality check to catch formatting errors and corruption. Smart outlier checks and root cause analysis keep you from chasing ghosts – or hiding real process gaps. Get the framework down, and the rest is simple.
In this article:
- The Quality Check: Checking the data you work with and why it matters, missing and incorrect values, proper formatting, and data corruption
- Outliers and Variation Study: Why a variation check is a must, different ways of checking outliers (Box Plot, Quartile Approach/IQR, Standard Deviation), and managing overreaction
- To Trim or to Keep: When to trim data vs. when to keep it, and the ethics of data sampling
- The Golden Standard: Root Cause Analysis (RCA): Applying RCA to data issues, avoiding common pitfalls, and establishing preventive methods
The Quality Check
Before you even begin working up the Excel motors and reactors, you need to take a big step back. Yes, you read it right: we don’t start analytics just like that. There’s an entire process to it actually, and the first and most important thing is the quality check. To make the journey a bit easier for you, I already have a list of articles you might want to check out as they touch on the following aspects of interest: data understanding, data types, statistics intro, and data ethics and privacy.
What is a quality check when it comes to data?
The concept is very simple actually: you take a good look at the entire dataset you are about to start analyzing and do an inspection on multiple layers to make sure everything is in order. Think of it as an ingredient check before you start cooking something, since (I assume) you would prefer to have a good meal prepared with fresh and good ingredients.
The biggest mistake a first-time manager can make when working with data is to just start whatever analysis they need to do without properly going over the information. When people just “start analyzing data” without actually doing a proper quality check on said data, they allow themselves to be set up for failure, as inaccurate data is not usable… or if you use it, you end up with the wrong conclusions.
Missing values are the first thing you could look at when performing the check. These are anything and everything that fall under the “something from my data is missing” aspect, like for example:
- Fields in your report that should have something in them, but for some, they don’t
- Empty cells for no reason
- Incomplete information (like missing dates, sales numbers, or any other field)
- Missing column names
I have a simple trick I tend to use here, what I call an “eyeball check” on the data, and this is how it goes: I add filters on my report (assuming we are working with an Excel file), and for each column in the report while using the filters, I check one by one to make sure I have no empty cells – or at least ones I can see with the “naked eye.” Then I start using tools like a pivot table to check more in-depth for missing information, and of course, use AI in case you want an extra layer of checks.
Incorrect values are the next stop on the road to a good data quality check, and just like with missing values, we start observing (first with the “naked eye” and then with proper tools) if whatever information we have in our report is correct or not. Of course, this can be many things, but one that I find to be the most common is the date – for sure the stuff of nightmares for many people working with Excel.
Proper formatting is another thing one should check, as many Excel files (especially ones filled manually by other people) have very poor quality regarding the accuracy of the information and, as such, are very likely to contain incorrect formatting. This can mean having values with the wrong currency, accounting data formatted as something else, using “,” instead of “.” and many other similar examples that can really impact your analysis.
Data corruption is our last stop on the road to a quality check, because in these times there is no topic more relevant than this one. Corrupted data is basically what it sounds like: a string of information that is no longer usable in its current form because it was altered beyond use. Oddly enough, this is something we experience a lot when working with tools like Excel, for example:
- Scientific Notation and Truncation of Long IDs: Excel will convert numbers longer than 15 digits into scientific notation (1.23E+12).
- CSV Date and Leading Zero Stripping: Opening a CSV file directly in Excel causes it to strip leading zeros from your data (turning 01234 into 123, destroying the string length) or auto-convert dates into other formats.
- Ghost Ranges and Bloated File Sizes: A corrupted sheet’s used range often expands out to row 1,048,576 or column XFD because a few stray formats or spaces were left behind, turning the sheet into a sluggish, freezing monster that causes recalculation errors and corruption warnings.
- Broken Formulas and Reference Errors: Sudden #REF!, #VALUE!, or #N/A explosions caused by source rows or columns being deleted out from under dependent formulas, or external links breaking because a shared network drive path changed.
- The Dreaded “Unreadable Content” XML Error: Excel files (.xlsx) are essentially zipped XML packages. If Excel or a third-party app crashes mid-save, the internal XML structure gets scrambled, leading to the frustrating error message: “Excel found unreadable content in ‘file.xlsx’. Do you want to recover the contents?” – which often strips out charts, conditional formatting, or macros upon recovery.
The Outlier and Variation Study
On the road to successfully dealing with data when things are not as they should be, first-time managers often skip a very important step: the outlier and variation study. I say important because outlier checks and a proper study of variation can save you hours (maybe even full days) in terms of data analysis, wrong conclusions, and incorrect decision-making. This is because we tend to base our decision-making process on the accuracy of the data, but when the information we are working with is not scanned or properly assessed for additional impacting factors, we tend to make the wrong decisions and end up with a failure.
Say, for example, you have a back-office team and the average processing time is around 8 minutes. If you plan to flat out reduce this to 4–5 minutes without actually checking all other elements (outliers, variation sources, etc.), you could walk into a trap. What if 90% of your team is already at 4–5 minutes on average, but 10% are outliers due to legacy systems, incorrect input, out-of-date procedures, etc.? This could be a recipe for disaster if not managed properly.
Outlier checking can be done by multiple means; I will show you 3 of the ones I tend to use most of the time. Firstly, an outlier is a data point that is outside the “normality” of your data, meaning if you have on average 5 minutes (say around 98% of your data), but a few values are at 25 minutes, we call those outliers.
Method 1 for outlier checking: Use a box plot.
Just select the data you have, go to Charts, All Charts, Box and Whiskers.
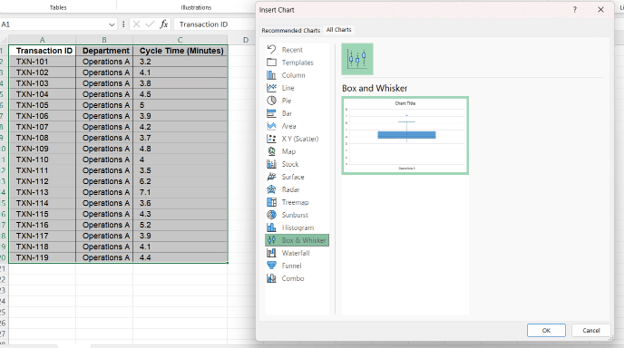
The Box Plot will automatically calculate the identified outliers for you. The actual calculation is similar to Method 2, which I will present next.
In a Box Plot, you will see the outlier as the value that “stands out” far away from the rest of your data, along with other valuable information like: Q1, Q2 (Median), Q3, Minimum value, and Maximum value (excluding the outlier).
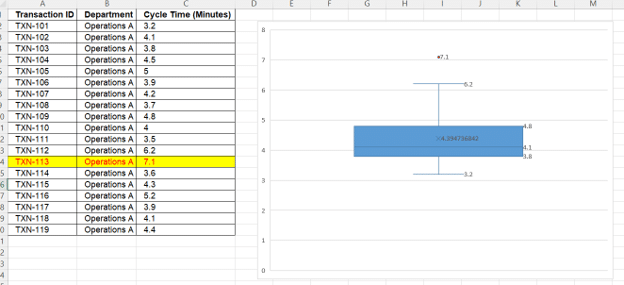
Method 2 for outlier checking: Quartile Approach.
Any dataset can be “divided” into Quartiles, which are a representation of it. The first of these quartiles is the 25th one, or the value under which 25% of the data lies. The second is the 50th or the median, and much like the first, it means that 50% of your data lies below this value. Then we have the 75th one and the 100th one (or the maximum value).
To calculate outliers using this method, we need to establish the Interquartile Range, or IQR. This is nothing more than Q3 minus Q1.
The Excel formula for quartiles is: QUARTILE.EXC or QUARTILE.INC, where EXC excludes the median and INC includes the median. In the formula, all you have to do is select the data you need and the quartile you need to calculate (1 for the first, 2 for the second, and so on). So in essence, you need to run the same formula at least 2 times to get Q1 and Q3.
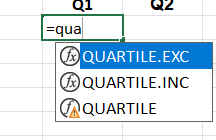
Say for the dataset we had earlier, these are the values that we have calculated with this method:
- Q1 is 3.85
- Q3 is 4.65
- IQR is 0.8 (meaning Q3 minus Q1)
Now the outlier formula will capture 2 limits:
- Lower Limit: Q1 – (1.5*IQR)
- Upper Limit: Q3 + (1.5*IQR)
Any value that is below the Lower Limit or above the Upper Limit is considered an outlier. In our example, we have the LL at 2.65 and the UL at 5.85. Because of this, the value of 7.1 minutes in our table is considered to be an outlier – it is above the 5.85-minute mark.
Method 3 for outlier checking: Standard Deviation.
Using the standard deviation of the dataset. IMPORTANT NOTE: This method is used only for normally distributed data (data that takes a bell-shaped form and is symmetrical on either side of the mean).
It is similar to Method 2, but we will no longer be extracting quartiles and calculating the IQR; instead, we will be calculating the mean and the standard deviation of the dataset. Based on these values, we will create the Lower and Upper Limit as follows:
- Lower Limit: Mean – 3 * Standard Deviation
- Upper Limit: Mean + 3 * Standard Deviation
Variation is all about standard deviation, and the more checks you do on this, the better off you are understanding what is going on in your dataset. Remember, always look at what sources of variation you have, why you have them, and if they should be there in the first place.
To Trim or to Keep
A question for the ages in data analysis and for sure a source of stress, confusion, and headaches for first-time managers. I wish we had a simple answer to this one, but I’m afraid things are not like that.
Trimming or Keeping data will depend entirely on you and the specific situation you are in. When you have a lot of past outliers that are no longer present – meaning they have been eliminated by various methods – and you need to re-check current team performance, you will of course eliminate the past values (as keeping them to re-check if the team has corrected the results would be wrong). Eliminating outliers from the beginning just to hide process gaps or issues, however, would be a no-no.
The process comes down to the goal you have and how honest you want to be with yourself. You can decide to hide wrong values and just go with the fancy, good-looking numbers, but that doesn’t mean you will have any meaningful insights or success.
Corrupted data, or data that is incorrect or otherwise not recommended for usage, should be trimmed in my opinion, as its very usage will impact the analysis. You would be better off with a smaller sample size containing correct and accurate information. At least for the sample you analyze, you can be sure the insights are good and can be relied on.
The Golden Standard: RCA
Yes, people, we are here once again: Root Cause Analysis. Nothing in people management can escape this, as deep-diving into the real causes of a problem will save you entire weeks of failure and unnecessary work. You have an entire article about it here: Root Cause Analysis (RCA): The Starter Pack.
The main idea behind the concept of RCA for Data Issues is to identify the source, check for correction, and establish clear preventive methods. The last thing you need once you fix a data issue is to repeat it.
The RCA itself is exactly like any other; the only actual difference is that you will be doing it for data, and not for errors or breaches of KPIs. Just stay focused on the investigation, use a proper 5-Why analysis, and find the root cause, not the surface ones.
All in all, data management with missing, anomalous, or outlier data is a hard job, but it is part of the manager’s role, as we have to work with data every single day. The important thing is to have the correct framework available and to know what to do, when to act, and how to do it. The rest is simple.
Until the next article, peace out!