
How do I speed up delivery without wrecking accuracy or budget?
At a certain point in the job, a people manager must work with, balance, and learn to navigate the three pillars: efficiency, quality, and cost. While to a first-time manager this can appear to be less of a framework and more of arcane magic, I assure you everything can be nicely packed into a logical structure, and given enough time and exposure, you will know how to handle it.
We always end up here because every leadership role must have a link – a bridge, if you will – with the business. I see things like this: you have the leader part, where you grow, develop, and nurture people, and then you have the business area, which, given the right context, grows as well. At the end of the day, management was created because businesses needed someone to govern the human aspect. To achieve this, we must learn how to juggle these three concepts, each having its own footprint in the business: efficiency with how well we organize things, quality, which speaks to the output and how good or bad it is, and finally cost, which in today’s economy is probably one of the most closely watched metrics.
What should a first-time manager know about efficiency, quality, and cost?
To successfully balance efficiency, quality, and cost, first-time managers must avoid pushing single metrics like handling time, evaluate the operational triangle holistically, and pair primary goals with guardrail metrics to eliminate rework, prevent bottlenecks, and achieve realistic, continuous operational improvements.
In this article:
- The Three Pillars: Management requires balancing Efficiency (speed), Quality (accuracy), and Cost (budget). Changing one always impacts the other two.
- Avoid Blindly Pushing Single Metrics: Pushing for speed alone usually leads to more errors and rework. Use simple data (like Excel regression) to see how your metrics affect each other before making changes.
- Pair Metrics with Guardrails: According to Goodhart’s Law, targeting only one metric (like cutting handling time) leads to rushed, sloppy work. Always pair speed or cost targets with quality guardrails to protect output.
- Diagnose Friction Before Spending: Don’t throw money at bottlenecks. Use Value Stream Mapping to find process friction, eliminate rework (a major capacity drain), and reduce complex handoffs first.
- Focus on Holistic, Realistic Progress: Avoid unrealistic targets. Involve your team in metric reviews and aim for small, steady improvements over time rather than risky, massive overhauls.
When We Try Things Without Understanding
Let’s take it from the beginning! Assume we are starting out in the job and have the following report to look at:
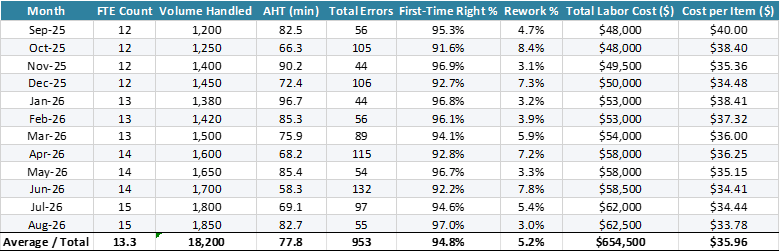
In it, we can see a lot of information, such as:
- Month
- FTE Count: Number of people on our team
- AHT: Average Handling Time in minutes – how many minutes on average it takes 1 person to manage one request
- Total Errors: How many errors were generated in that month
- First Time Right: How much of the volume we got right the first time, calculated as
- Rework: How much of our volume comes back to be redone, calculated as
- Labor Cost: Total amount of money associated with the human aspect (salary, insurance, office space, bonuses, taxes, etc.)
- Cost Per Item: How much money processing one ticket costs, calculated as
With a basic understanding of what we are looking at – and mind you, this is a very simplistic example – it’s now time to talk about what happens when we try to handle things without understanding what we are doing.
Many first-time managers, especially because they lack proper business training before actually starting the job, will push the team in different directions based on the “current issue.” Say you are one of them and you get an email from upper management pushing for a reduction in handling time. Like any new person on the job, especially one without the necessary exposure, you start pushing the team to reduce that handling time. This can have a much more severe impact on the team and business than you might think. Let’s look at this visually using the report we already have.
The first thing we need to look at is the potential influence one aspect has over another; in our case, we have AHT as a measure of Efficiency and Errors as a measure of Quality.
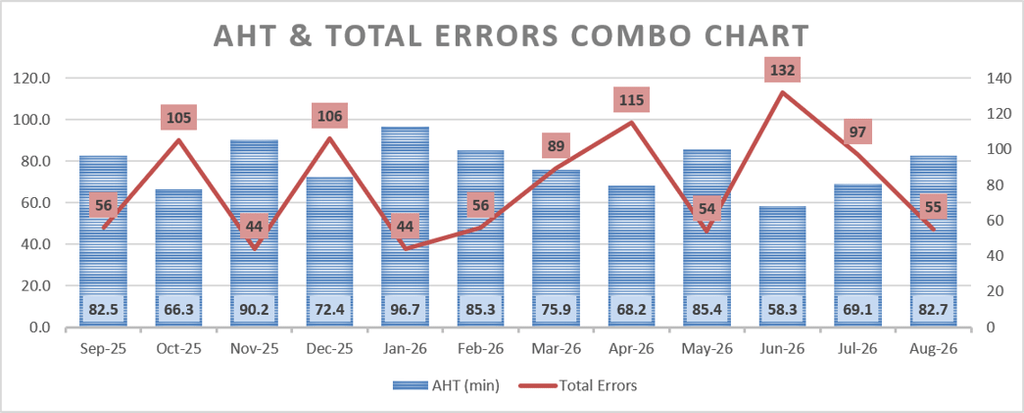
What do you notice in this chart? Well, the immediate thing that pops up is the fact that errors tend to increase when the AHT goes down, like so:
- Oct ’25: 105 errors with an AHT of 66 min
- Dec ’25: 106 errors with an AHT of 72 min
- Apr ’26: 115 errors with an AHT of 68 min
- Jun ’26: 132 errors with an AHT of 58 min
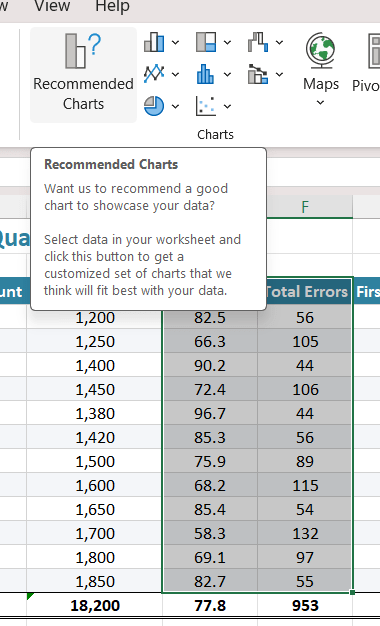
If we want to be 100% sure this is a real trend, we can always run a quick regression test. This is done very easily in Excel: select the two data columns you need (errors and AHT in our case), go to Recommended Charts, select the Scatter Plot (for numerical data sets, it should be the first one that appears), add a Trendline, go to Trendline Options > More Options, and at the bottom, select Display Equation on chart and Display R-squared value on chart.
Quick statistics workshop:
- Regression is a way to pair up two (or more) sets of numerical data to see if and how they correlate with one another.
- The
value indicates how strong the relationship is: the closer it is to 1, the stronger it is.
- The Equation provides a formula to calculate one of the variables when you know the other.
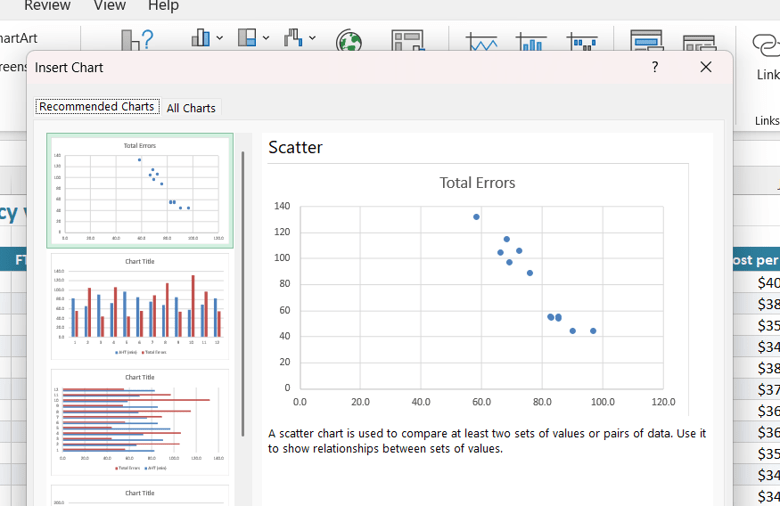
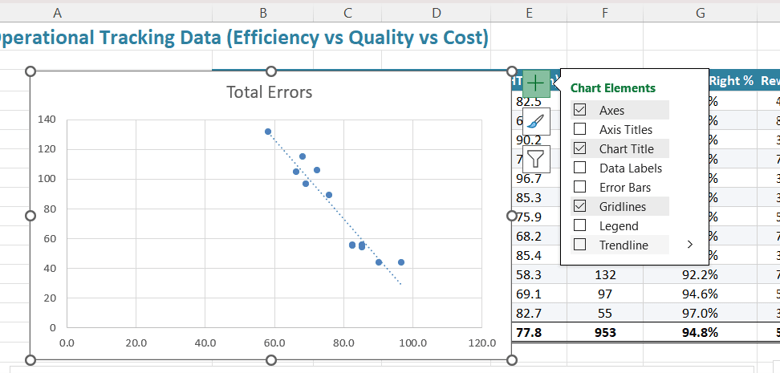
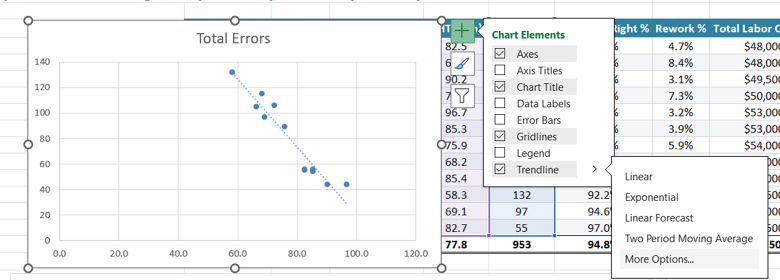
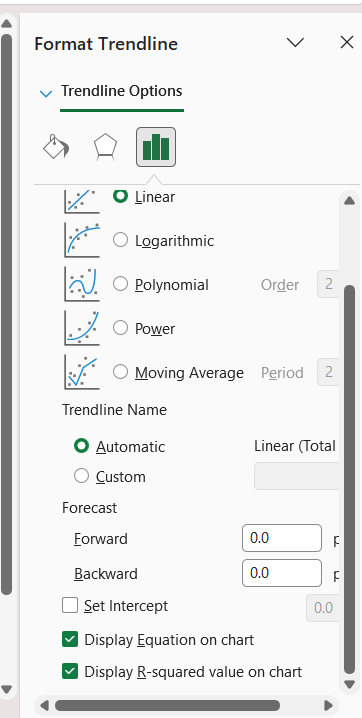
So, let’s go back to our data and see how this actually looks:
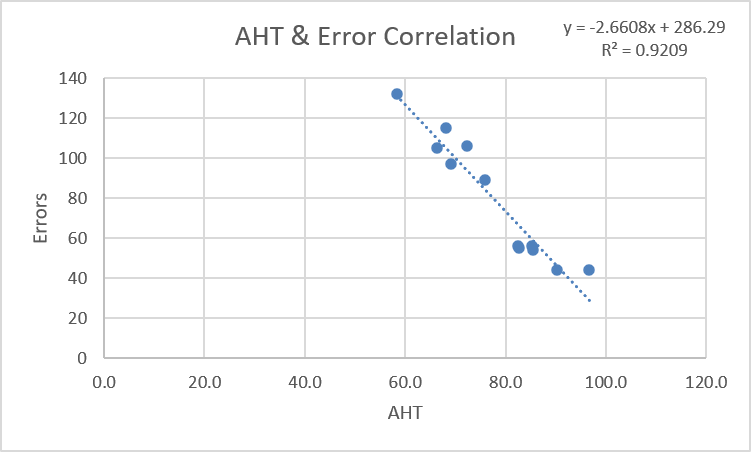
We have a strong correlation between  (Errors) and
  (AHT). is the output/problem we are looking at, while is the input/cause impacting it. In our table, we have a
  correlation index between these two. If we look at the equation, we can actually use it to calculate different scenarios and see how many errors we would expect at different AHT levels.
Full circle back to the initial idea: we pushed the team to decrease AHT, and without really understanding the impact of this action, we created a bigger problem – months with massive spikes in errors. And that is only part of the issue, because one thing is linked to another. Higher errors mean more rework time, more rework means less time for new volume, less pay from the customer because we promised quality work for the price they are paying, and so it goes, on and on.
When you try to go fast and push different initiatives on your team, you must always remember this: nothing comes without a price, especially when you are working with the same tools. It’s like trying to make three loaves of bread with the same amount of ingredients you would normally use for one. This is why balancing efficiency, quality, and cost is such a core and critical aspect of the leadership role.
When We Understand the Operational Triangle
With a better understanding of the core issue of acting blindly, it’s time to talk about what is most often called the Operational Triangle: Efficiency, Quality, and Cost.
Each represents a very specific fragment of your business, and the better you understand them, the better off you will be.
Efficiency is all about the speed of your process and how fast work items flow through your team. Many metrics can track this; in our example, we used Average Handling Time (and in most companies or teams, this is constantly on the table). You can measure this in multiple ways – usually, we find it as an average, but keep in mind that in some cases an average is not the best option because it is susceptible to extreme outliers. You can find a practical, non-confusing guide on this in my article: Intro to Statistics: A First-Time Manager’s Guide.
Quality is all about how often the work you do is done right the first time. It’s a measure of the care and rigor put into the work. High-effort work, where people are dedicated, double-checking, and ensuring things are done by the book before shipping them out, rewards you with a higher-quality output. Measuring it is a broad topic with many different approaches for auditing and reporting, but I promise that will be a topic for a future article.
Cost is the accumulation of all financial aspects that feed into the team: salaries, taxes, office space, technology, software, security, support functions, etc. All these costs are rounded up and drilled down to the individual employee level, giving you an estimated bill for how much it costs to have one person working on your team. From the customer perspective, we also add profit margins to these numbers (we are, after all, in the business of making money).
Looking at these metrics individually and in isolation is one of the biggest mistakes first-time managers make. When stripped apart, these operational triangle elements do not function well. They are not distinct ecosystems that can operate alone. They are deeply connected, and whatever happens to one will impact the others. Think of it as a multi-layered domino effect: you can’t push one piece without affecting what’s in front, behind, above, or below it. For this exact reason, when we evaluate any of these three, we must account for all of them.
When We Pair Metrics to Prevent Blind Spots
The best, healthiest, and most common way to tackle this is to pair your metrics. The trick is knowing what to pair and how to evaluate them together.
Speed pairs exceptionally well with errors because they directly capture efficiency and quality. You cannot simply boost efficiency in a process without impacting quality – unless you increase cost through investments like hiring more people, getting better tools, streamlining procedures, or adjusting customer expectations. For this exact reason, AHT and Errors work so well together in our example: whatever you do to one side must be monitored on the other to avoid unintended side effects. Don’t worry about anticipating every single scenario in advance; just make sure you are always looking at both metrics together.
Matching metrics is easy once you look at the bigger picture. For example:
- Delivery speed pairs excellently with customer satisfaction or defect count.
- Cost-cutting goals should be matched with output volume to avoid under-resourcing.
It’s also important to mention Goodhart’s Law: “When a measure becomes a target, it ceases to be a good measure.” If you tell your team to cut processing times by 30%, they will hit that target – often by skipping verification steps, rushing customer interactions, or pushing unfinished tasks down the line.
Guardrail metrics are the non-negotiable boundaries set alongside primary metrics to prevent “toxic optimization.” They act as safety nets: your team can innovate and push speed or cost savings as hard as they want, provided they do not cross the line on quality, accuracy, or compliance. I have an entire article on this topic if you want more context: Goodhart’s Law: When Metrics Backfire.
When We Diagnose Before Spending Money
A major mistake leaders make is reacting before actually understanding the root cause. Most often, the knee-jerk reaction to a bottleneck is throwing money at it – usually by adding headcount, buying better tools, or paying for expensive training. While these might fix parts of the problem, they aren’t guaranteed solutions because the money was spent before the issue was actually understood. Proper diagnosis is key.
Your first step should be identifying friction points in your process, and a great way to do that is by performing a quick Value Stream Mapping exercise. You can find all the details you need in my guide: Value Add Activity: First-Time Manager Handbook. Once friction is correctly identified, gather your team of experts and brainstorm ways to eliminate it. Don’t fall into the trap of throwing money at the issue right away – try to solve it without extra spend first by looking for internal team or process solutions. If that doesn’t work, then going with a paid option is perfectly fine.
Another crucial – yet frequently overlooked – area to monitor is rework. As a lead, you have a bird’s-eye view of team operations, and one eye should always be searching for rework. Rework represents output that failed the First Time Right test; it was faulty, and now extra effort must be spent fixing it. That means spent time on a ticket that should have been closed, less time available for new volume, and a direct hit to team capacity. Rework is a capacity drainer. The more rework you have, the less efficient your overall process becomes.
Take a hard look at the handoffs within your team: how often they occur, who is involved, at what stage they happen, how they impact your SLAs, and what exceptions exist. The more you study the handoffs outside the “happy path,” the better off you’ll be. A well-designed process should be simple; if yours has too many handoffs, layers, or overly complex routing, start there. That is usually where bottlenecks and pain points hide.
Understanding That Holistic Balance Beats Everything Else
In the end, it all comes down to balance in all things. It’s not just about pushing quality to the next level, making a process hyper-efficient, or driving costs down to zero; it’s about what we can realistically achieve right now with our current resources. Can you make two loaves of bread from the materials meant for one? Sure – if you make them smaller, and as long as your customers are fine with that tradeoff. It’s a matter of making deliberate, incremental adjustments across all three aspects to keep them in equilibrium. That is what the operational triangle is truly about: maintaining long-term balance.
Set realistic thresholds instead of chasing absurd targets. Perfection isn’t the goal. The internet is full of “new-age” success formulas promising flawless execution, but humans don’t work that way. We make mistakes, we vary in performance, and we don’t operate like machines. This unique mix of human variation is what makes management challenging – and rewarding. The harder you try to force a perfect process with perfect scores and perfect people, the faster you will fail. Keep it grounded, stay realistic, and remember that you manage people, not algorithms.
A common mistake new managers make when making decisions is excluding the team – or including them in a way that feels like a high-stakes audit rather than a healthy, collaborative check-in. Review metrics and operational changes in an open forum with the people doing the actual work. If you try to judge performance from an ivory tower using purely numerical models, you will quickly lose touch with reality. Talk to your team, gather input, and don’t judge a situation at face value: first learn, then reflect, consult, and decide.
Finally, adjust your targets as your team progresses. As long as your expectations stay grounded, you won’t run into issues. Aim for small, steady increments of progress with minimal operational disruption, rather than chasing massive, dramatic shifts that risk causing permanent damage. Small, continuous improvements over time will always yield a bigger impact than a massive overhaul that breaks your operations or fails to take root.
Until the next article, stay happy, healthy, and safe!