
How to better understand data if I am not an analytical person
You made it! The role is yours, you’ve met the team, the customer, even had some 1-on-1s and everything is looking so lovely. But then you get an epiphany: I am not an analytical person… what am I going to do with all this data I’m supposed to handle? Most first-time managers experience this fear. You look at other, more experienced leaders, you get an overload of dashboards, reports, PowerPoints and all sorts of tools and systems with hundreds of pages of numbers and you just freeze. What are you going to do? What will people think of you when they realize you don’t actually have these “advanced analytical skills” everyone around you seems to have?
What to do to overcome data anxiety if I’m not an analytical person?
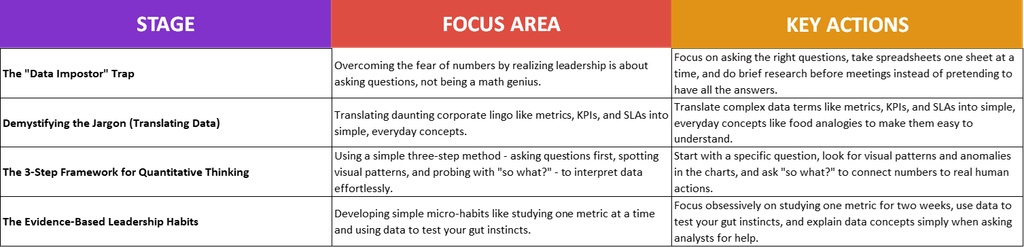
First-time managers can overcome data anxiety and the “Data Impostor” trap by realizing leadership relies on asking the right questions rather than math expertise, demystifying jargon like metrics, KPIs, and SLAs, applying a three-step analytical framework (questioning first, spotting visual patterns, and asking “so what?”), and building evidence-based habits such as focusing on one metric at a time.
Your Non-Analytical Lead’s Guide to Data RoadMap:
The “Data Impostor” Trap
Many new managers struggle with this idea that they must navigate the world of management, as a non-analytical person, by becoming a “data impostor” (a person who isn’t mathematically gifted and yet must appear to be so). Let’s set the record straight: you don’t need to be a math genius to be a successful leader. This is a misconception a lot of people interested in middle management have, and yet are turned off by the position because they assume you need all these over-the-top analytical skills. In reality, shaping your view from a more personal one to a more analytical one is a matter of exercise, experience and will. There are very few people naturally gifted from this point of view; most first-time managers fall under the “learn as you go” category. Great leaders are not the people who perform well with numbers. Their role is to coach, help and guide the team along the way. So, it’s not about the statistics, it’s about asking the right questions.
You don’t need to feel like the impostor. You are at the start of the management job and it’s very normal and natural to have a learning curve. Expectations right now are more along the lines of whether you can handle the role and adapt to it, rather than delivering high-level analytics. The fear of overwhelming spreadsheets, looking foolish, or misinterpreting the data are the most common ones. Trust me when I say this: in time you will master all of these fears. Here are some tips I’ve learned along the way:
- Too many spreadsheets: Stay calm, take them 1 sheet at a time and try to make sense of them from your perspective. Study a sheet for a few minutes, check what data goes into it, write it down (if that helps), and create an image of what this is about in your mind. You don’t need to understand (for now) how it works, just what it is about.
- Looking foolish: If you feel you are less prepared for a topic (and this will happen very often as a new manager), research it more. Let’s say tomorrow you have a meeting about some KPI that’s not doing great. Take 30 – 60 minutes and do some research on it: what is this KPI about, how important is it, how is it calculated, what is the impact of having it below target? Talk to your team and get a bit of history (if you can); just do your homework. If people want very specific, very niche answers and you don’t have them, just say “let me check on this and get back to you.” You don’t need to give answers when you don’t have them.
- I can’t properly interpret the data: This will happen very often at the start. Take a deep breath and do your research. You have so many tools today that can support you and offer proper explanations. Just go and use them, ask people, ask AI… do everything you can to understand the data.
Demystifying the Jargon (Translating Data)
A very common issue with first-time managers and their fear of data is the jargon. Many just get lost in all the technical babble and give up. There’s no need to put so much pressure on yourself just because you are not familiar with all the lingo. Every time you are dealing with a new concept or a new term you are not familiar with, try to make sense of it in your own mind: what does it mean when you hear the word, and how can your brain translate that into something you relate to? Try to use personal examples you are very familiar with. For example, I use food examples when I don’t understand a concept (because food is everywhere, so it’s simple to just adapt it to any business). So, let’s get you started on the road to jargon with the 3 words you will hear most often.
Metric: The measure. This is any raw data point that can be tracked. Metrics answer the question “What is happening?”. They are not good or bad; they are just a measure, a neutral information. For example: number of tickets, total time spent on a ticket, total customers managed in a day, etc.
KPI: Key Performance Indicator. This is the goal, the value you need to reach with your team. This is a select, highly strategic metric chosen by the business to measure progress toward a business objective. It will answer the question: Are we achieving our goal?
Example 1:
- Objective: Improve the response time
- KPI: Average Handling Time
Example 2:
- Objective: Improve the customer waiting time
- KPI: Average Waiting Time
SLA: Service Level Agreement. This is the promise. SLAs are formal operational commitments (contracts) that specify the minimum defined standard performance for a specific topic. It will answer the question: what is the agreed-upon threshold of service? For example: IT Support (99% system uptime per month), Customer Service (90% of urgent tickets responded to in 15 minutes), General (98% Quality Score).
The 3-Step Framework for Quantitative Thinking
So, we now know a bit more about how to integrate a non-analytical leader into the story, we have a bit of context on what some of the key concepts are, but what do we do with the non-analytical leader? Where do we start and what do we do? What is the plan?
It’s a great question, and to answer, let’s look at a very simple, yet very efficient way of working – a framework, if you will. It’s a 3-step method that will help you on your journey to the analytical side of things.
Step 1: Question First, Data Second.
In general, it is better for the less analytical person to have a slow, yet steady ramp-up in terms of shifting their view from “less data” to a more analytical one. To achieve this, it’s best if you always have a sort of hypothesis after looking at any dashboard/report. Let’s say you are looking over the performance of the team over the last month; instead of saying “let me look at all these charts,” direct a question at 1 specific thing at a time, like “why did the Average Handling Time increase last month?” This way you get a bit closer to the data, you start thinking about what information you see there, and you are familiarizing yourself with it. It will be a slow process, yes, but with sufficient time, patience, and practice, you will get there.
Step 2: Looking for Patterns and Anomalies.
A lot of first-time managers rush for the numbers immediately when they open a deck or report. Don’t do that! It’s not going to help you very much since you are not really comfortable with the data yet. What you can do instead is check patterns and anomalies: spikes, drops, repeating trends, and so on. It’s much easier to observe and learn visually than it is by looking at numbers. Visuals will always trump the more traditional “lots of numbers and text.”
Step 3: So What?
Sounds kind of stupid, I know, but it will really help you. Asking “so what?” after each data point will help you understand the human connection. Let’s say the Average Handling Time increased by 20% in the last 3 months. So, what happened? Well, maybe this is connected with a higher volume of work, maybe with attrition (some employees left, others joined and they need more time until they become as efficient as the more experienced ones), maybe a change in procedure, or maybe a change in the product.
The Evidence-Based Leadership Habits
A lot of work will go into your shift to the new way of thinking. Like I said, this will be a long journey, not something you will do in 1 week. There’s no such thing as a fast, easy guide. To break the cycle, you need to establish new habits. These new habits are not going to come overnight; you don’t just wake up the next day and start doing things completely differently. You need time to adjust. To help you do that, here are some micro-habits that I tried and tested:
- 1-by-1 Focus: Pick 1 single metric, monitor it, study it, and learn everything you can about it for the next 2 weeks. During these 2 weeks, make sure you track it daily. This obsessive study will help you acclimate better to the new mentality.
- Trust your gut: Use your gut feeling and treat it like a hypothesis, then use data to verify said hypothesis. Let’s say your gut says “something is wrong with the handling time”; go look at the data and check and see if there’s something wrong with it or not.
- Adapt – adapt – adapt: The word of the day. Many new managers will just assume everyone 100% understands what they want. That is not the case. Let’s say you need help when talking to an analyst; don’t just go to them and say “can you please tell me what’s wrong with the handling time?” The analyst, dealing with reports and analytics all day long, won’t know exactly what you mean. Try to explain it like you would to someone else (say, your parents—that’s always helpful because it makes you shape your thoughts into easier-to-follow explanations).
Final Thoughts
It’s very important for you, right now, to stay focused and dedicated. Try not to get too stressed out about analytics; it’s way too early to panic. Set a personal goal for your first 30 days; maybe select some key points and study them in more detail. Make that your goal. Or be the master of one of the KPIs after 30 days, just understand absolutely everything there is to know about it. Hiring managers might put a lot of pressure on you from this point of view, trying to make you aware that it’s crucial to understand all the reports and dashboards as soon as possible. Resist this and inform them you need time; be patient.
You don’t have to build the dashboard yet. You just need to understand it. This is why we first observe: we try to get a firm grasp on the subject and then move to more in-depth analysis.
Always ask for help when you need it. Don’t let pride, shame, or fear of what people will think of you stand in your way to success. An efficient leader is a leader who knows when to ask for help, when to leave pride at the door, and who will always put the welfare of the team before their own.
Here are some related articles than will help you along the way:
- Corporate Jargon: A First-Time Manager’s Guide
- Leading Indicators – Lagging Indicators
- Data Analysis Paralysis: What, Why and How
- Data Ethics and Privacy: The New Manager’s Guide
- Intro to Statistics: A First-Time Manager’s Guide
- Data Types: A Beginner’s Guide
Hope this helps you! Until the next article, stay healthy, stay happy, and help others as much and as often as you can.