
How do I know if a metric actually matters to the business?
Picture this: you just landed a new role, and there’s excitement, joy, worry, and pressure all over the place. People are anxious to get to know you, customers want to talk to you, and upper management is looking over your work like a hawk. And then there’s you: sitting in your own little corner, trying to make heads or tails of things. After some intense analysis, you come to the conclusion that maybe you should start sending out reports on different aspects to impress people. Because you’re new to this, it’s maybe not very clear to you what is actually relevant for the business. Hence the trap: are you looking at actionable metrics, or do you just like some vanity ones and keep producing them?
So, what should you do, as a first-time manager, when it comes to metrics that actually matter?
To drive real business value, new managers must ditch flattering vanity metrics and focus on actionable ones by passing the three-part test ensuring data drives specific decisions, has clear causality, and offers fast feedback, while auditing dashboards to align two to three core metrics with departmental goals and asking “So what?” before tracking any new number.
Here is your starter roadmap for Vanity vs. Actionable Metrics:
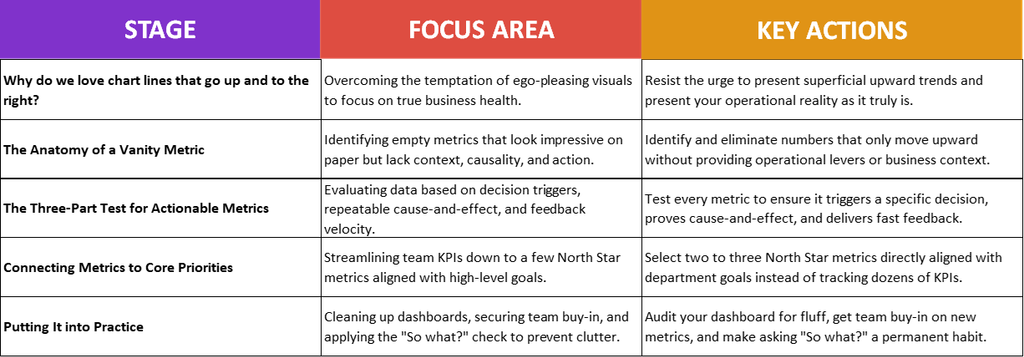
Why Do We Love Chart Lines That Go Up and to the Right?
It’s perfectly normal for any new manager (and maybe some more experienced ones) to like the good old-fashioned chart line that goes up and to the right. I mean, just look at it… what’s not to love, right?
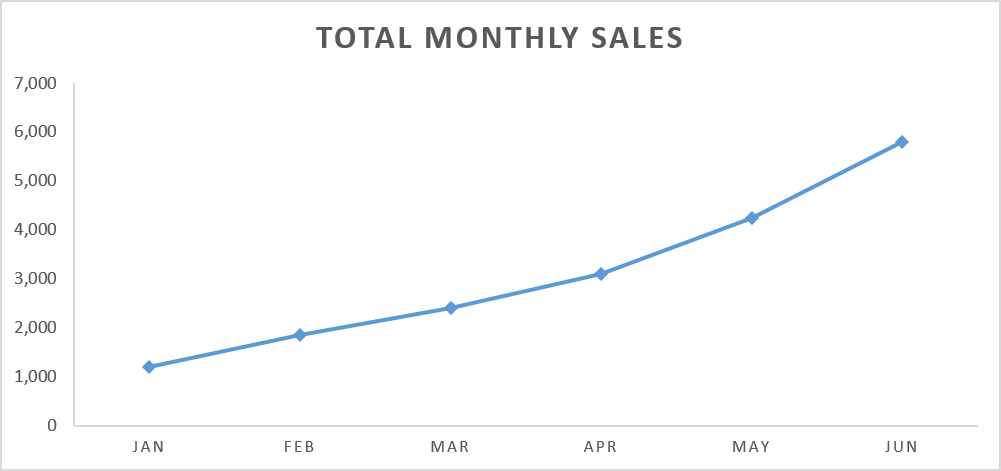
Well, the thing is – while we all love a good ascending trend chart because it gives us that “oh, that’s a nice trend that keeps going up” feeling, we need to be mindful of what exactly we are looking at. Is this something that truly matters, or am I just creating charts and reports because they look good?
It’s quite common practice, especially for new managers, to go directly to this sort of visual representation because they assume it will have a bigger impact and send a much more positive message. In reality, that’s not what you actually want: people and processes are not to be catered to like a helpless child. You need to present the situation “As Is,” not as something you want it to be. Showing people a completely different facet of the business can actually impact both team morale and performance.
The danger with tracking numbers that look good sits in the core idea of it: it’s like trying to sell a house that is in really bad shape, not investing in it, but just giving it a bit of paint to make it look good from the outside. Vanity metrics, as we call them, are aspects of the project that look good but have no actual meaning. They can take many shapes and layers of importance, but all of them have one thing in common: they have little to no impact on the actual business.
It’s also a question of ego, and I am sure some of you know this type of person: I call them the political leader, because regardless of how bad the team’s performance is, they will use absolutely any other possible metric to show how well they are doing.
The Anatomy of a Vanity Metric
Vanity metrics are numbers that look great on a slide deck and make your team feel accomplished, but tell you almost nothing about the actual health or direction of your business.
What Makes a Metric “Vanity”
A metric qualifies as “vanity” when it only moves in one direction (up) without providing context on efficiency, quality, or revenue. It satisfies ego rather than informing strategy. The defining trait of a vanity metric is its lack of causality: if the number goes up by 20% tomorrow, you usually have no clear, repeatable operational lever to explain why, nor does it give you a clear next step to take.
Data, in its natural form, will always have an element of predictability, and when numbers just grow without any reason behind them, something is wrong. (If you need a small recap on how to deal with data as a first-time manager, check out these articles: I’m Not Good with Data: The Non-Analytical Lead’s Guide and Data Types: A Beginner’s Guide.)
Common Vanity Metric Traps:
- Total/Cumulative Sign-Ups: A classic “up and to the right” chart. Showing 100,000 cumulative registered users looks impressive, but it masks how many of those accounts are dormant, abandoned, or churned.
- Page Views & Impressions: Getting 50,000 hits on a blog post feels fantastic. However, if those visitors bounce within 5 seconds without taking an action, buying a product, or subscribing, the traffic generated zero business value.
- Social Likes, Followers & Shares: High engagement counts create an illusion of brand authority, but high follower counts do not automatically translate into customer acquisition, pipeline generation, or retention.
- Downloads / App Installs: App downloads measure top of funnel reach, not product value. If 90% of users uninstall the app after day one, high download volume simply means wasted acquisition spend.
How They Distort Team Performance and Focus:
- False Sense of Security: Celebrating surface-level spikes blinds teams to underlying operational issues, such as poor retention or declining unit economics.
- Misaligned Incentives: When managers reward teams for vanity targets (e.g., “publish 10 posts to get views”), employees optimize for quantity over conversion and user retention.
- Wasted Operational Energy: Teams spend hours building reporting dashboards around numbers that don’t drive business decisions, pulling bandwidth away from solving core operational bottlenecks.
The Three-Part Test for Actionable Metrics
It’s hard to work with these concepts, especially as a first-timer (I know because I’ve experienced this too). In my first 12 months as a Team Lead, I had to figure out how to navigate between actual impactful metrics and hold off on my desire to present all sorts of analytics that just made me feel good. Luckily for me, my manager was very gifted with numbers, so it was very hard to trick her with random, good-looking figures. If you are struggling with this concept, worry not; there is a 3-part test you can try out to see if you are looking at vanity metrics or actionable ones.
1. The Decision Test: Does it drive a specific action?
An actionable metric must have a direct, pre-planned “if/then” response attached to it. Before adding a number to your report, ask: “If this metric drops by 15% tomorrow, what specific operational lever do we pull?”
In my first year, I was always looking at the total number of customers we signed at the end of the month because my impression was that this would for sure impact the business. In reality, however, about 20% of them had very short contracts (just a few months, some month-by-month). So this was not actually helping: if you sign them for 3 months, they will generate churn very fast, and you might get overwhelmed faster than you think. What I should have been looking at was the duration of the contract, creating a dedicated view per category: 3 months, 6 months, 12 months, etc.
2. The Causality Test: Can you explain and repeat the result?
You must be able to establish a clear cause-and-effect link between your team’s inputs and the metric’s outputs. If a number goes up simply because of seasonal traffic or a random viral post, you haven’t built a business process, you just got lucky. Actionable metrics isolate specific behaviors so you can double down on what works and kill what doesn’t.
- Vanity: Total daily foot traffic entering the shop.
Why it fails Causality: Foot traffic might double today simply because it started pouring rain outside and people needed shelter, or because a street festival happened to pass by. The owner didn’t do anything specific to earn those customers, and they can’t force it to rain again next Tuesday to repeat the result. You got lucky, but you didn’t build a repeatable process.
- Actionable: Redemption rate of the “Buy 5 Coffees, Get 1 Free” punch card within 14 days.
Why it passes Causality: There is a direct cause-and-effect link. You gave a customer a specific incentive (the card), and you can measure whether that exact incentive caused them to come back faster. If card redemptions jump by 30%, you know why (the loyalty offer worked), and you can repeat it next month to get the exact same outcome.
3. The Velocity Test: Is it fast and clear enough to act on now?
Data that arrives 30 days after a decision is made is a post-mortem, not a management tool. An actionable metric delivers feedback quickly enough for a team leader to adjust course within the current operational sprint or work week. It must also be simple enough that anyone on the team understands what a good or bad signal looks like without needing a data scientist to translate it.
- Vanity: Quarterly customer satisfaction surveys delivered 6 weeks after quarter-end.
- Actionable: Weekly customer support first-response time and first-contact resolution rate.
Connecting Metrics to Core Priorities
One of the simplest – though not always easiest – ways to achieve this is by mapping out your team’s performance to high-level company goals. Sometimes in corporations, it’s very hard to do this because higher targets get so diluted by the time they hit your team that nothing is remotely similar to the initial goal. This is why smart companies always have a good structure and system in place to make sure whatever company-wide goal they need to achieve is drilled down to the frontline level.
If you are in this situation, the best way to go about it and my personal preference, is this:
- Check the department goal: What is the director trying to achieve? What are the priorities for the next quarter? What are the pain areas right now?
- Align your metrics: Go over each of them and check how and where you can incorporate them into your team’s performance.
- Get buy-in: Check with your team before implementing them. Make sure they understand why you are doing this and get an “unofficial sign-off.”
- Iterate: Monitor, test, check for impact, and react based on what you observe.
Don’t track absolutely everything. Remember, we talked about this in our article Performance Management Dashboard: Essential Starter Tips: you don’t want your team completely overwhelmed by 50 KPIs of different colors. Just pick 2–3 North Star Metrics and stick to them instead of tracking every single detail.
It can also happen, sadly, that your boss might be a big fan of vanity metrics. In this case, you need to be ready to explain why you are ignoring them. Make a solid business case, stick to numbers, and make sure you highlight the actual impact they don’t have.
Putting It into Practice
To get started, the first thing you need to do is audit your dashboard. Check for any useless fluff, anything that is either just there to look good or doesn’t really drive decisions, and start cutting it out. You need a solid, functional structure if your goal is achieving actual impact.
Consult your Subject Matter Experts, people on your team who have more experience, or maybe the more vocal team members who always have a point of view. Use every available resource to get things into perspective. Once this is clear, you can start putting things in place for a better way of working.
Then comes the hard part: how to explain actionable data to the team without making them feel too much pressure. Many bosses tend to just drop new expectations on people, hoping it’s enough to just say something and the team will do it. People need a good reason for change, and they need to believe in it. When they don’t, you only get half the drive. You want them at 100%, not 50%.
Start with relatable examples and specific situations that are clear and understood by everyone. Explain the connection between X and Y, helping them see why one thing should be improved and the impact it has on another.
And probably the most important aspect: make it a habit to always ask “So what?” before adding any new metric. Keeping things simple and constantly assessing whether a number actually matters is a vital, practical habit for a good leader. This serves as a self-check on any new metric; otherwise, you will end up with the same amount of clutter six months from now.
Until next time, stay healthy, happy, and safe!