
What are leading and lagging indicators, how do they differ in business, and how can real-world examples help you predict results instead of just measuring past outcomes?

It’s your first week on the job, and as a first-time manager, you start receiving all sorts of emails and dashboards filled with new and interesting data points. Red, yellow, and green just flood your visual field, and a feeling of “what is going on here?” starts to take root in your mind. You get confused, scared, and start to worry that so many things you see right now just don’t make any sense. Maybe with a bit of time and familiarity, you’ll get used to them, calm down, and, just as things appear to be normal, other questions start to emerge: Can I use all this data to actually predict something instead of just measuring past outcomes? It’s crazy, right?
Well, yes and no! I can tell you for sure you are on the right track, but you just need a bit of help navigating this topic to better understand what you are really looking at. The thing with first-time managers is that they don’t have enough training (or proper training, anyway) on the types of indicators they will be working with. Upper managers will usually give them a brief overview of what each KPI is, maybe explain the basics, and then let them take over. This is the point that causes the indicator overload I was talking about above.
But I have you covered today, don’t worry. We will go over these types of indicators step-by-step, explain what they are, give some very clear examples, and help you answer the question: How do you use them to predict things instead of just measuring past events? Here are the main topics of this article:
- Intro: The Speedometer vs. The Rearview Mirror Dilemma
- Understanding Leading and Lagging Indicators
- The Cause-and-Effect Metric Plan
- How to Put Metrics into Practice Without Losing Your Mind
- Final Thoughts
Intro: The Speedometer vs. The Rearview Mirror Dilemma
I want you to think about this topic as driving a car, a task most of us are familiar with. Maybe you don’t drive per se, but you sure know what it means and can understand the concept. Working with these different types of indicators is very similar to driving a car, mostly because a lot of managers are usually focused on the wrong thing. Just like in a car, most people will first look in the rearview mirror and not at the speedometer. In operations, this means managers are usually focused on checking out what happened, placing their attention a lot more on this aspect instead of also looking ahead.
When you focus only on events that have already transpired, you lose something very valuable: the ability to predict what will happen next. It’s because of this focus on “the rearview mirror” that we get sidetracked or trapped into an endless loop of RCAs and action plans for missed indicators, failing to see what’s right in front of us: potential future outcomes and how to mitigate them.
In essence, when dealing with data as a manager, you must pay attention equally to two distinct aspects:
- Past Outcomes: What actually happened in the last month, how to explain it, and how to help your team not repeat whatever mistakes they made.
- Future Outcomes: What can happen based on your data, potential future risks, and a contingency plan to help you deal with risks when they appear.
A great leader is one who knows how and when to shift their focus from the past to the future, and this navigation between them is what makes some teams very successful. For example, if you see things that generated issues in past performance, instead of spending so much effort on why it happened, just map out the RCA, move to potential future outcomes, and figure out how to deal with them: check patterns, look at behavior and trends, forecast, and implement different mechanisms that can help you mitigate risk.
Understanding Leading and Lagging Indicators
Now that we understand the concept a bit better and know what we should do, let’s talk about the specifics and see what leading and lagging indicators actually mean. To help us do that, we will use a very simple example of six indicators from a made-up team’s activity.

In this fictional example, we have three domains: Sales, Customer Support, and Team Operations. Each of them has two distinct indicators: one leading and one lagging. Let’s look at them individually and see what they are all about.
Sales Development is mainly focused on sales growth, and to support this type of metric, the team has two indicators:
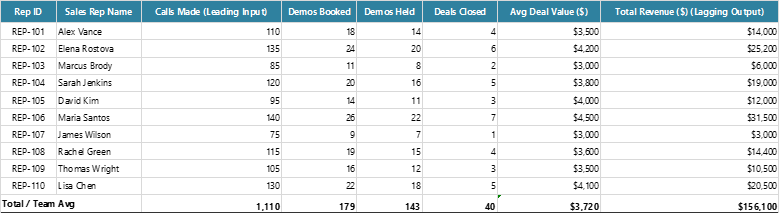
- Prospecting Calls Made: Meaning the number of calls people make. This is what we call a leading indicator because it’s basically an input: they need to reach 400 per month, and right now they are at 143.
- New Monthly Revenue: Meaning the sum of all the new deals made. Each month the team must reach a total of $50K in new deals, and so far they are at $156K. This falls under the category of lagging because it is an output.
Customer Support is mainly focused on customer satisfaction. To achieve this, the team focuses on:
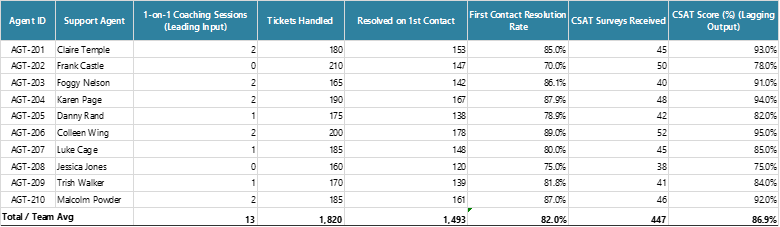
- 1-on-1 Coaching Sessions: When the Lead prepares the Sales Reps for calls with potential customers. They need at least 16 in a month, and right now they are at 13. This falls under the category of a leading indicator because it is based on input.
- Customer Satisfaction Score (%): Based on a post-interaction survey, each sales rep gets a satisfaction score from the customer. They need to be at least at 90%, and right now they are at 86.9%. Since this is an output-based indicator, it falls under lagging.
Team Operations is all about the health picture of the team (well, a very small picture here, but you get the point). We have two major drivers for team health:
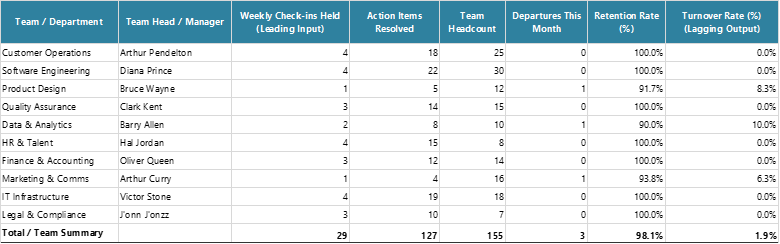
- Weekly Team Check-Ins: Proactive checks done by the lead to identify burnout, potential attrition, or satisfaction issues within the team. They need at least 12 per month, and right now they have 29. Because this is based on input, we put it in the leading category.
- Employee Turnover Rate: The historical data of people who left the team. They have a maximum target of 2% per month, and right now they are at 1.9%. Because this is based on output, we mark it as lagging.
Now, let’s talk a bit about what each type of indicator can actually do. It is important to treat them as you would any other tool: know when and how to use them, as this will make all the difference in your success.
- Leading Indicators (Prospecting Calls Made, 1-on-1 Coaching Sessions Completed, Weekly Team Check-ins Held): These are all input-based as we saw, and because of this, they are excellent when it comes to tracking a specific goal. We use them to make sure the team is going in the right direction from a specific point of view. For example, with prospecting calls made, we need at least 400 and right now we only have 143, meaning we still need 257 more to reach our target. The downside of leading indicators is that we can’t use them for prevention or mitigation; they simply do not provide the exact data we need to check if we might actually have an issue in the future.
- Lagging Indicators (New Monthly Revenue, Customer Satisfaction Score, Employee Turnover Rate): These are all based on output, which is why they are excellent at predicting success or failure. We look at them and try to understand what might happen. A very basic example would be this: with $156K done so far (as of August 20th), we have an average daily revenue pace of $156K / 13, meaning $12K per day. With only 8 days remaining and using the data we have so far, a basic estimation would be $12K × 8 = $96K, closing August at around $252K. This is what we mean by using output to look at future events. It’s why this type of indicator is great for predictions but very hard to track moment-to-moment—you don’t know what the numbers will actually look like until you have the final data.
The Cause-and-Effect Metric Plan
To showcase more on this topic, we need to look at specific details from our team. We know the overall picture; now let’s look at specifics and check how to create a good cause-and-effect metric plan.
To create a proper cause-and-effect metric plan, we need to follow a few simple steps in principle:
- Identify the final outcome you want to influence.
- Work backward to find the daily and/or weekly behavior that drives it.
- Pair one leading metric with one lagging metric.
A common trap here is measuring activity instead of progress. Now, let’s look at an example for each major domain to see what that looks like.
Let’s assume this is what our Sales Development data looks like.
This is our Customer Support data.
And this is our Team Operations data.
Sales Development
- The Cause (Leading Input): Prospecting Calls Made per Rep (Target: 400 calls/month)
- The Effect (Lagging Output): New Monthly Revenue (Target: $50,000)
How the Pair Works in Practice:
Looking at reps like Elena Rostova (135 calls – $25,200 revenue) versus Marcus Brody (85 calls – $6,000 revenue) shows a clear link: call volume directly fuels demo bookings and deals closed. If you notice mid-month that total calls are lagging at 200 instead of 400, you don’t need to wait for the month-end sales report to know revenue will drop; you can intervene immediately by coaching reps on outreach volume.
Customer Support
- The Cause (Leading Input): 1-on-1 Coaching Sessions Completed (Target: 16 sessions/team)
- The Effect (Lagging Output): Customer Satisfaction Score (Target: 90% CSAT)
How the Pair Works in Practice:
Agents like Colleen Wing and Karen Page, who received 2 coaching sessions, hit CSAT scores of 94%–95% and First Contact Resolution (FCR) rates around 88%. Conversely, agents like Frank Castle, who received 0 coaching sessions, dropped to 78% CSAT and 70% FCR. The leading metric (coaching) builds skills and confidence before agents handle complex tickets, directly protecting customer satisfaction.
Team Operations
- The Cause (Leading Input): Weekly Team Check-ins Held (Target: 12 check-ins/month)
- The Effect (Lagging Output): Monthly Turnover Rate (Target: Under 2%)
How the Pair Works in Practice:
Departments where managers held 4 regular check-ins per month (like Software Engineering and Customer Operations) resolved 18–22 team blockers and experienced 0% turnover. In contrast, departments where managers held only 1 check-in (Product Design and Marketing) saw unresolved issues pile up, resulting in team departures (8.3% and 6.3% turnover). Holding weekly check-ins acts as a predictive radar for burnout, allowing managers to fix issues before an employee hands in their resignation.
How to Put Metrics into Practice Without Losing Your Mind
Because there is a lot of data to go over, we must be understanding and realistic about one thing: too much of this might overwhelm people, including yourself and your team. To avoid this, you need to add some very simple daily habits for yourself and your team to keep everyone on track without the feeling that “this is too much.” You don’t have to follow absolutely everything, every time, all at once; you just need to have a good working structure.
You can, for example, have dedicated days for each indicator (if the business allows it – instead of sending reports each day for all of them, split them across different days), or prioritize them based on outcome and current performance to decide what to communicate first. Use simple yet efficient steps to prevent people from feeling like they are working for NASA.
Another thing you can do is use leading metrics in your 1-on-1s to avoid performance drops. For example, you can use prospecting calls made to check on how well performance is tracking and what can be improved: look at individual values vs. the team average, compare results from past months to see trends (if they spike or drop at similar timeframes, etc.), and look at standard deviations to see if someone on your team might be having issues. (If you need a recap on basic statistics, this article has you covered: Intro to Statistics: A First-Time Manager’s Guide).
It is also important to know when to tweak your indicators if the outputs are not changing. Always remember that working with people is not a simple, straightforward formula: what works today may not work tomorrow. As such, a good leader will always adapt and change. Sometimes you might try something that works (maybe with everyone, maybe with just one person), but that doesn’t mean it will work again tomorrow. Adaptability is what will keep you on track to success.
Final Thoughts
Going back to our car example, remember this: keep your eyes on steering the car, not on the accident report. Sometimes managers get stuck in their heads and focus on a completely different layer of the business or team instead of focusing on what actually matters. It’s important to maintain a good balance and not get sucked into aspects that can potentially cause you to fail.
Navigating leading and lagging indicators takes a lot of practice; you won’t be able to master this immediately after reading this article. Management takes time, practice, and a lot of effort and dedication. Always focus on your inputs in a way that makes your goals predictable.
And don’t be scared – try new strategies, adapt, and let yourself worry just a tiny bit… it’s normal and perfectly fine. Expecting 100% perfection is a recipe for failure, regardless of how much you feel it’s the right thing to do.
Until the next article, stay safe, happy, and healthy!